Top 3 Price Prediction: Bitcoin, Ethereum, Ripple – BTC, ETH and XRP consolidate after mas
February 8, 2026
Bitcoin (BTC), Ethereum (ETH), and Ripple (XRP) prices consolidated on Monday after correcting by nearly 9%, 8%, and 10% in the previous week, respectively. BTC is hovering around $70,000, while ETH and XRP are facing rejection at key levels. Traders should be cautious: despite recent stabilization, upside recovery for these top three cryptocurrencies is capped as the broader trend remains bearish.
Bitcoin price declined nearly 10% last week, reaching a low of $60,000 on Friday, and rebounded, retesting the daily resistance at $73,072 on Sunday. At the time of writing on Monday, BTC is trading at $70,700.
If BTC continues its recovery, it could extend the advance toward the daily resistance at $73,072.
The Relative Strength Index (RSI) on the daily chart is 34, pointing upward after rebounding from oversold territory last week, suggesting fading bearish strength and hinting at a recovery. However, traders should remain cautious, as the Moving Average Convergence Divergence (MACD) indicator showed a bearish crossover, indicating a continuation of the downward trend.
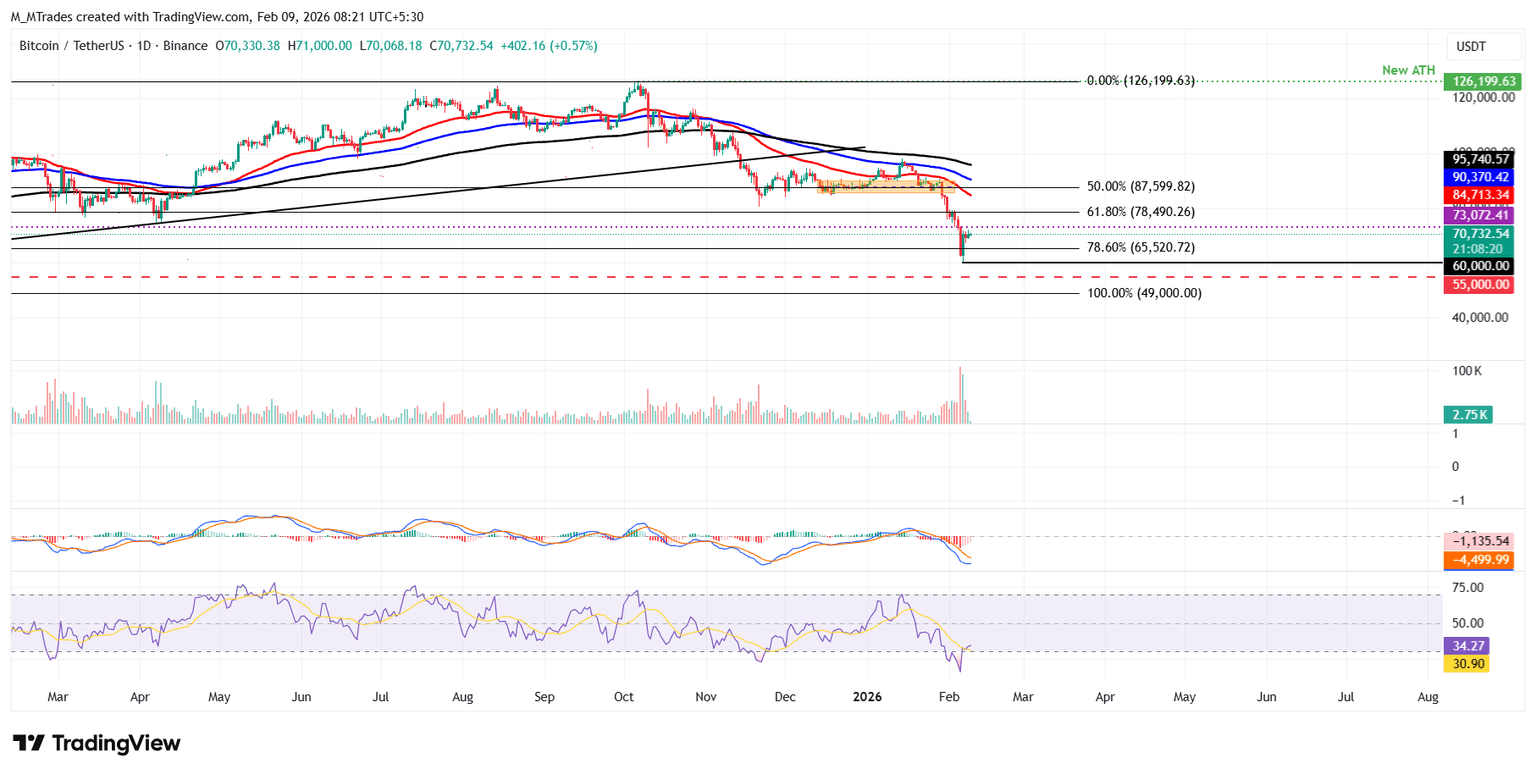
However, if BTC continues its downward trend, it could extend the decline toward the 78.6% Fibonacci retracement (drawn from the August 2024 low of $49,000 to the October 2025 all-time high of $126,199) at $65,520.
Ethereum price corrected more than 8% last week, hitting a low of $1,747, the lowest levels not seen since May 6, 2025, on Friday, before recovering to $2,149 through Sunday. As of Monday, ETH is hovering around $2,149.
If ETH continues its downward trend, it could extend the decline toward Friday’s low at $1,747.
The RSI on the daily chart reads 31, nearing oversold territory, indicating that bears are still in control of momentum. The MACD also showed a bearish crossover that remains intact, further indicating a negative outlook.
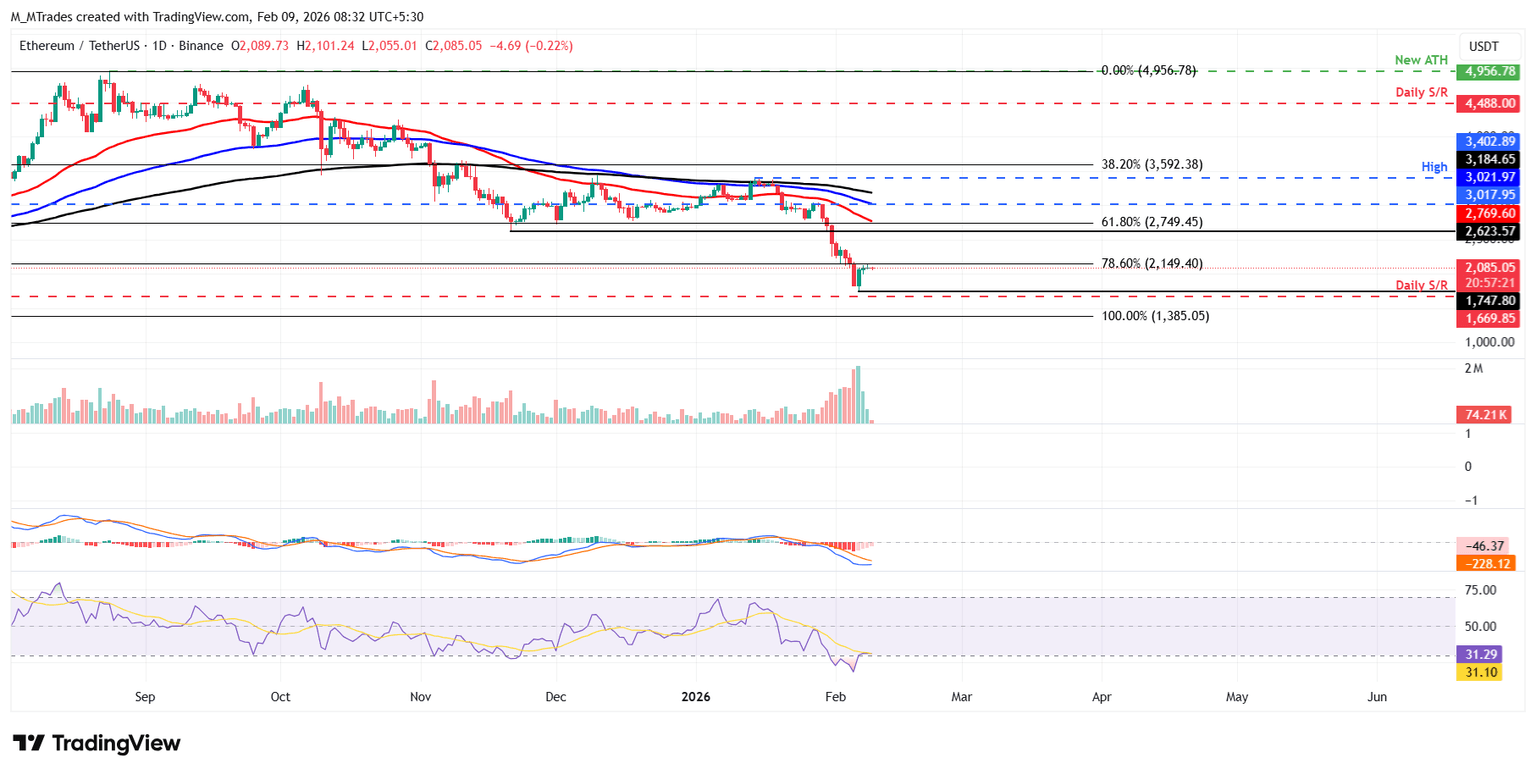
However, if ETH breaks and closes above $2,149 on a daily basis, it could extend the advance toward the next resistance at $2,500.
XRP broke below the lower trendline of the falling wedge pattern on Thursday, reaching a low of $1.11 on Friday, before revisiting this broken trendline boundary that day. XRP has been hovering around this boundary during the weekend. At the time of writing, XRP is trading at around $1.44.
If XRP continues its downward trend, it could extend the decline toward the weekly support at $1.30.
Like Ethereum, XRP’s momentum indicators (RSI and MACD) are also projecting a bearish outlook.

If XRP breaks and closes above the lower boundary of this pattern, it could extend the rally toward the 50-day Exponential Moving Average at $1.83.
The developer or creator of each cryptocurrency decides on the total number of tokens that can be minted or issued. Only a certain number of these assets can be minted by mining, staking or other mechanisms. This is defined by the algorithm of the underlying blockchain technology. On the other hand, circulating supply can also be decreased via actions such as burning tokens, or mistakenly sending assets to addresses of other incompatible blockchains.
Market capitalization is the result of multiplying the circulating supply of a certain asset by the asset’s current market value.
Trading volume refers to the total number of tokens for a specific asset that has been transacted or exchanged between buyers and sellers within set trading hours, for example, 24 hours. It is used to gauge market sentiment, this metric combines all volumes on centralized exchanges and decentralized exchanges. Increasing trading volume often denotes the demand for a certain asset as more people are buying and selling the cryptocurrency.
Funding rates are a concept designed to encourage traders to take positions and ensure perpetual contract prices match spot markets. It defines a mechanism by exchanges to ensure that future prices and index prices periodic payments regularly converge. When the funding rate is positive, the price of the perpetual contract is higher than the mark price. This means traders who are bullish and have opened long positions pay traders who are in short positions. On the other hand, a negative funding rate means perpetual prices are below the mark price, and hence traders with short positions pay traders who have opened long positions.
Search
RECENT PRESS RELEASES
Related Post


