Top 3 Price Prediction: Bitcoin, Ethereum, Ripple – BTC, ETH and XRP extend free fall amid
February 4, 2026
Bitcoin (BTC), Ethereum (ETH), and Ripple (XRP) remain under pressure so far this week amid the broader market sell-off. BTC reached its lowest level since early November 2024 at $72,945. ETH and XRP, following BTC’s lead, extended their losses, with ETH hitting a seven-month low while XRP also slid amid sustained selling pressure.
Bitcoin price closed below the 61.8% Fibonacci retracement level (from the August 2024 low of $49,000 to the October 2025 all-time high of $126,199) at $78,490 on Sunday. It corrected nearly 4%, hitting a low of $72,945 on Tuesday (a level not seen since early November 2024). As of writing on Wednesday, BTC trades at $75,700.
If BTC resumes its downward trend and closes below the daily support at $73,072 on a daily basis, it could extend the decline toward the key psychological level of $70,000.
The Relative Strength Index (RSI) on the daily chart reads 25, an extreme oversold condition, indicating strong bearish momentum. The Moving Average Convergence Divergence (MACD) also showed a bearish crossover on January 20, which remains intact with rising red histogram bars below the neutral level, further supporting the negative outlook.
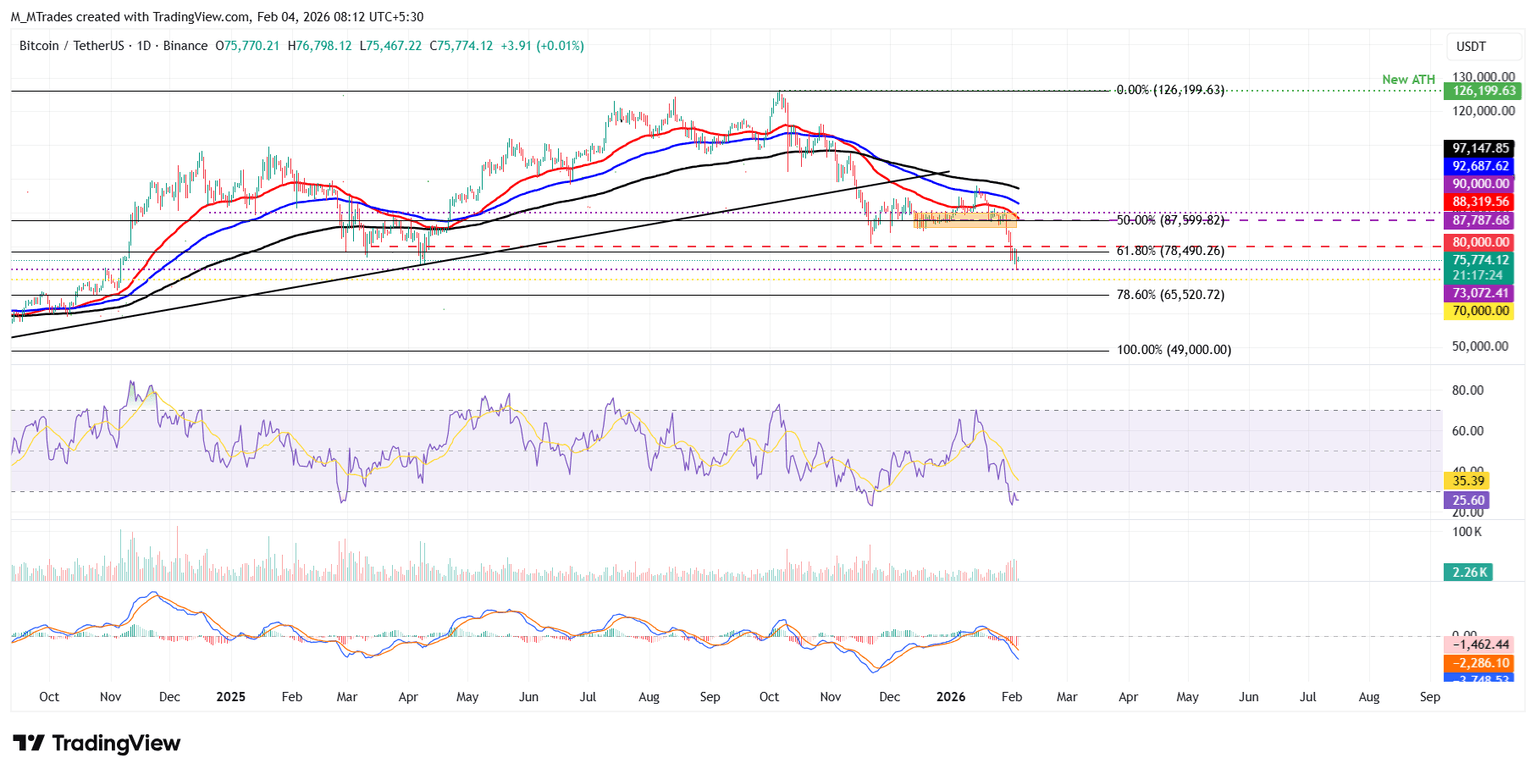
On the other hand, if BTC recovers, it could extend the advance toward the 61.8% Fibonacci retracement level at $78,490.
Ethereum price closed below the 61.8% Fibonacci retracement level at $2,749 on Friday and declined by over 17% through Tuesday, hitting a low of $2,110. As of Wednesday, ETH trades around $2,270.
If ETH continues its downward trend, it could extend the decline toward the key psychological level at $2,000.
Like Bitcoin, Ethereum RSI and MACD indicators on the daily chart are showing strong bearish strength.
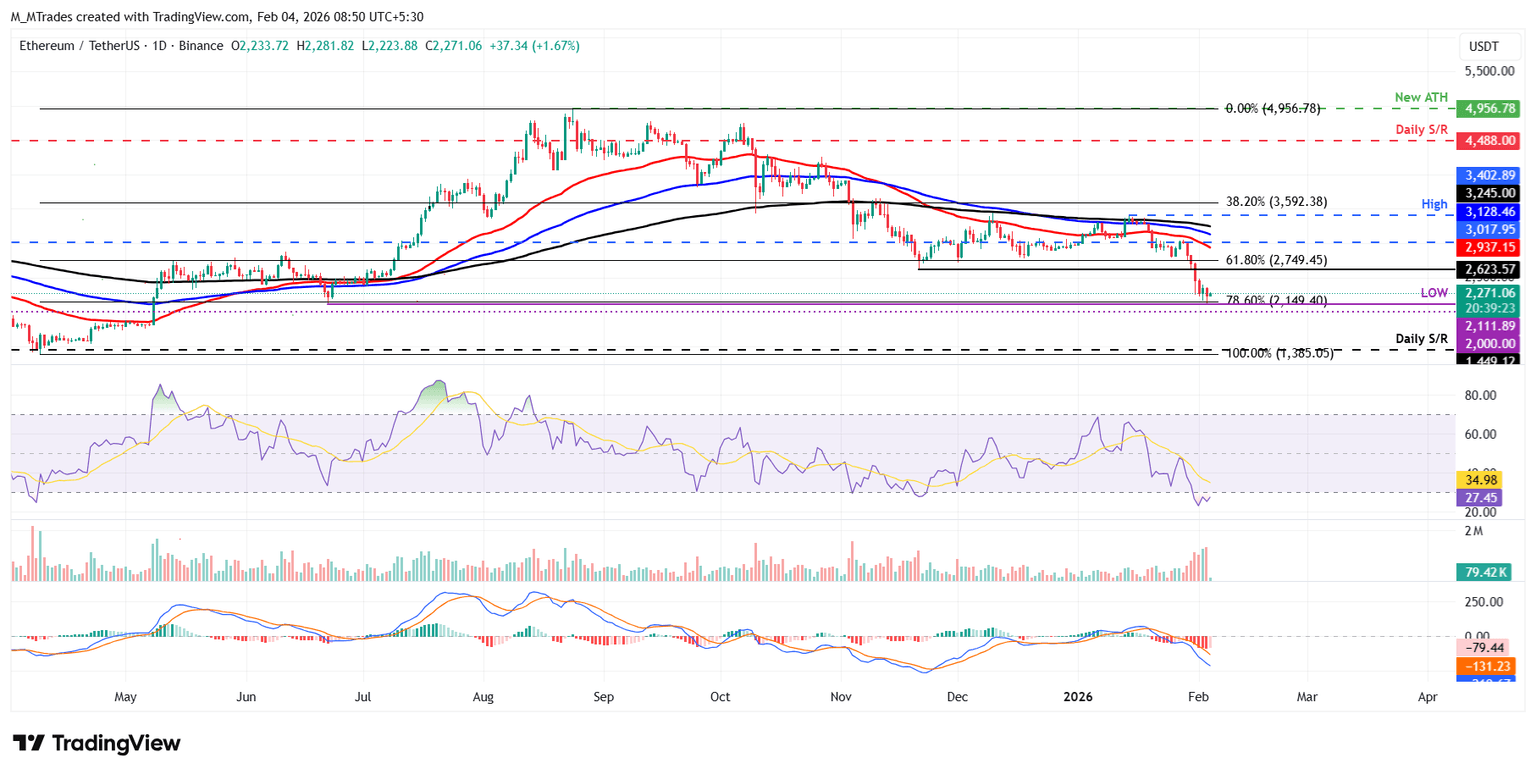
However, if ETH recovers, it could extend the advance toward the key psychological level at $2,500.
XRP price closed below the daily support at $1.83 last week and has been trading down toward the lower trendline boundary of the falling wedge pattern around $1.44 so far this week. As of writing on Wednesday, XRP trades at $1.59.
If XRP continues its downward momentum, it could extend the decline toward the lower trendline boundary of the falling wedge pattern around $1.44. A close below this level could extend losses toward the weekly support at $1.30.
Like Bitcoin and Ethereum, XRP’s momentum indicators (RSI and MACD) are also projecting a bearish outlook.
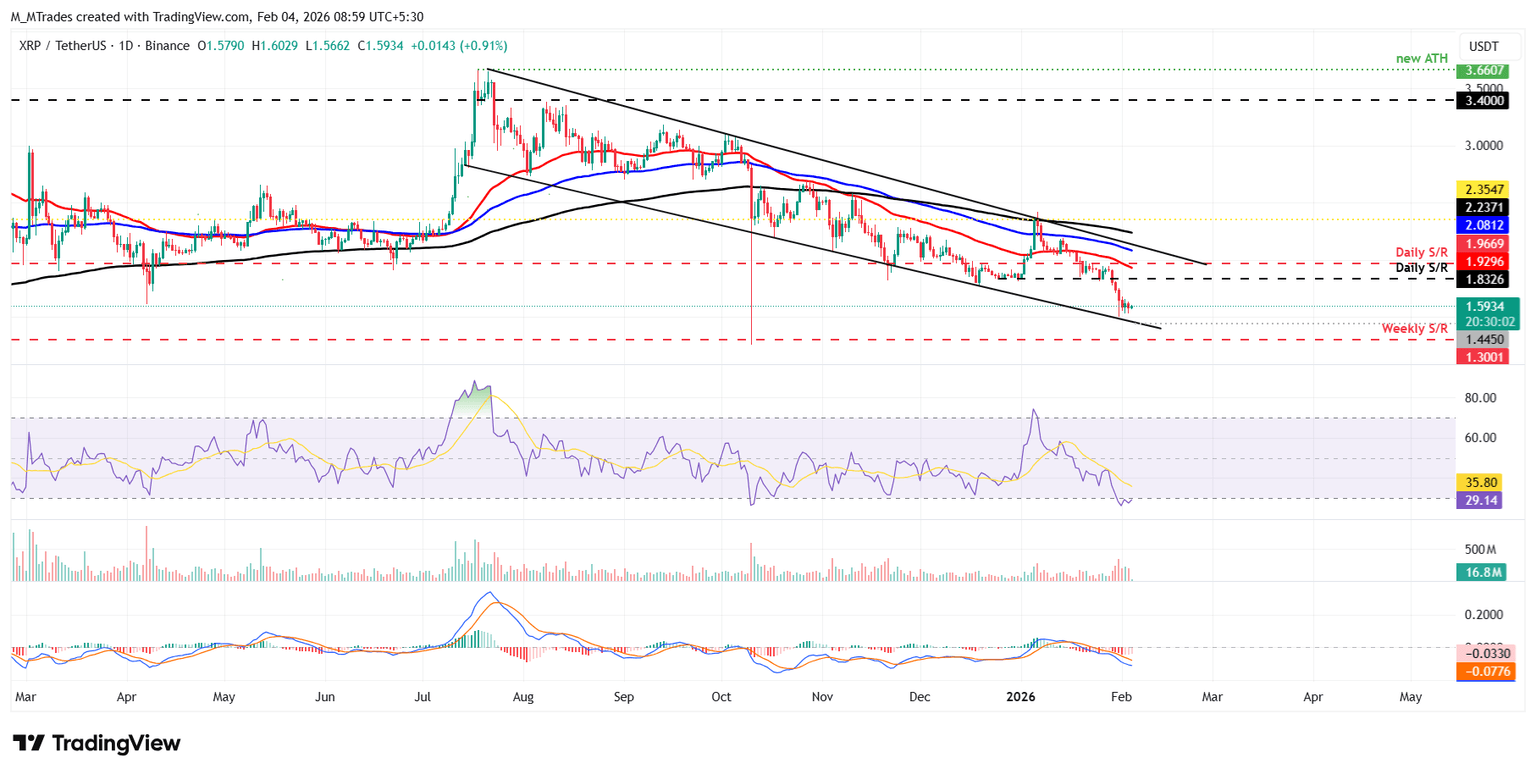
Conversely, if XRP recovers, it could extend the advance toward the previously broken daily level at $1.83.
The developer or creator of each cryptocurrency decides on the total number of tokens that can be minted or issued. Only a certain number of these assets can be minted by mining, staking or other mechanisms. This is defined by the algorithm of the underlying blockchain technology. On the other hand, circulating supply can also be decreased via actions such as burning tokens, or mistakenly sending assets to addresses of other incompatible blockchains.
Market capitalization is the result of multiplying the circulating supply of a certain asset by the asset’s current market value.
Trading volume refers to the total number of tokens for a specific asset that has been transacted or exchanged between buyers and sellers within set trading hours, for example, 24 hours. It is used to gauge market sentiment, this metric combines all volumes on centralized exchanges and decentralized exchanges. Increasing trading volume often denotes the demand for a certain asset as more people are buying and selling the cryptocurrency.
Funding rates are a concept designed to encourage traders to take positions and ensure perpetual contract prices match spot markets. It defines a mechanism by exchanges to ensure that future prices and index prices periodic payments regularly converge. When the funding rate is positive, the price of the perpetual contract is higher than the mark price. This means traders who are bullish and have opened long positions pay traders who are in short positions. On the other hand, a negative funding rate means perpetual prices are below the mark price, and hence traders with short positions pay traders who have opened long positions.
Search
RECENT PRESS RELEASES
Related Post


