Top 3 Price Prediction: Bitcoin, Ethereum, Ripple – BTC, ETH and XRP find key support, rev
January 9, 2026
Bitcoin (BTC), Ethereum (ETH), and Ripple (XRP) steadied above key support levels on Friday after being rejected at mid-week resistance zones. The short-term recovery prospects remain intact if the top three cryptocurrencies by market capitalization hold these support zones.
Bitcoin price rejected the 61.8% Fibonacci retracement level (from the April low of $74,508 to October’s all-time high of $126,199) at $94,253 on Tuesday. It declined nearly 3% over the next two days, retesting the previously broken upper consolidation zone at $90,000. As of Friday, BTC trades slightly above this support zone at $91,400.
If the $90,000 support holds, BTC could extend the recovery toward the key resistance level at $94,253.
The Relative Strength Index (RSI) on the daily chart reads 54, above the neutral level of 50, indicating slight bullish momentum. Moreover, the Moving Average Convergence Divergence (MACD) indicator shows a bullish crossover, which remains intact, supporting the bullish view.

However, if BTC continues its pullback and closes below $90,000 on a daily basis, it could extend the decline toward the next support level at $85,569.
Ethereum price pulled back after retesting its 100-day EMA at $3,298 on Wednesday and declined nearly 6% through Thursday. As of writing on Friday, ETH hovers around the 50-day EMA level at $3,128.
If the 50-day EMA at $3,128 holds as support, the ETH price could recover toward the 100-day EMA at $3,298. A successful close above this level could extend gains toward the December 10 high of $3,447.
Like Bitcoin, Ethereum’s RSI and MACD indicators signal bullishness, further supporting a recovery view.
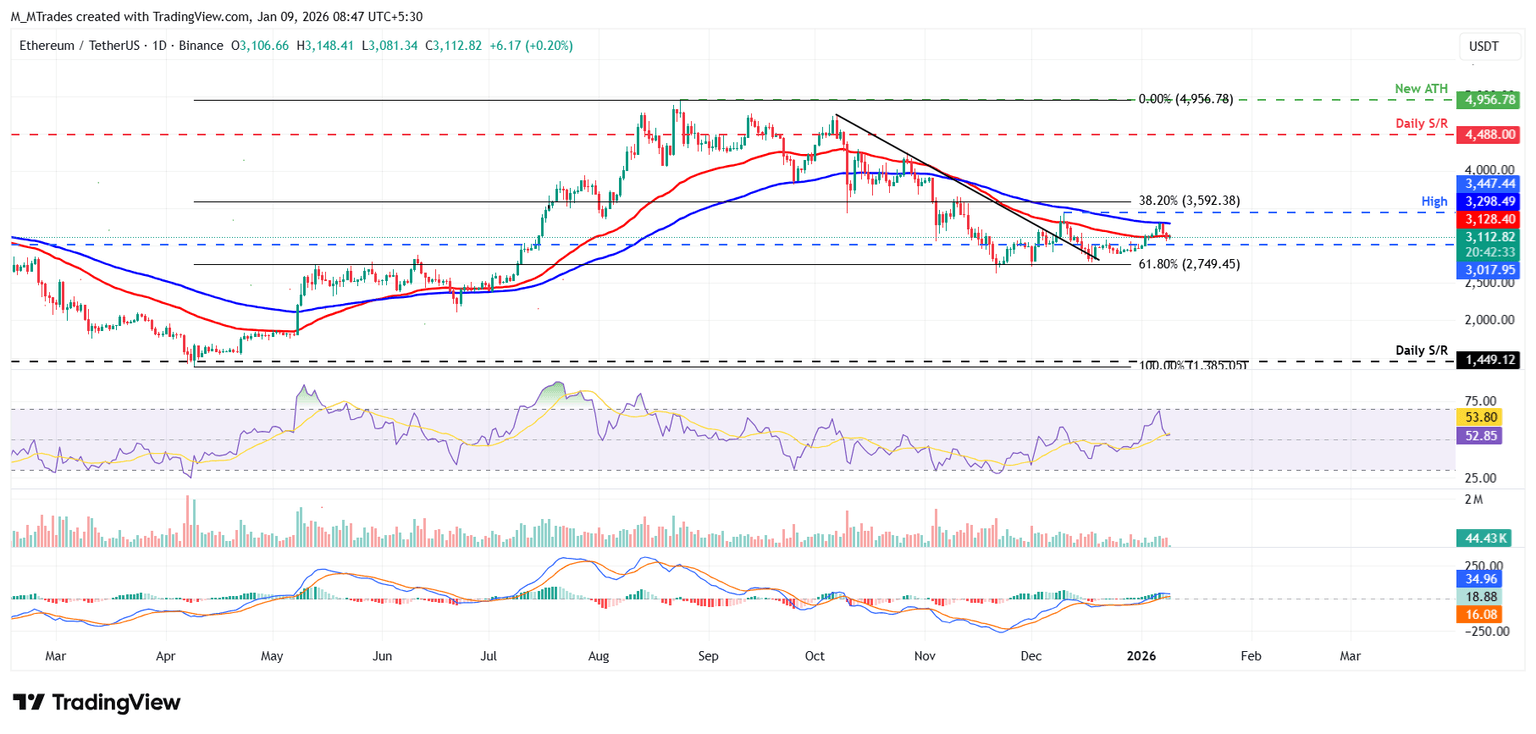
However, if ETH continues its correction, it could extend the decline toward the daily support at $3,017.
XRP price rejected the upper trendline of a falling wedge pattern on Tuesday and declined nearly 10%, resting at the 50-day EMA at $2.07 on Thursday. As of Friday, XRP trades above this support zone at around $2.13.
If the 50-day EMA at $2.07 holds, XRP could extend the recovery toward the daily resistance level at $2.35.
Like Bitcoin and Ethereum, XRP momentum indicators (RSI and MACD) showed bullish signals and support a recovery outlook.

However, if XRP closes below the 50-day EMA at $2.07 on a daily basis, it could extend the decline toward the next daily support at $1.96.
The developer or creator of each cryptocurrency decides on the total number of tokens that can be minted or issued. Only a certain number of these assets can be minted by mining, staking or other mechanisms. This is defined by the algorithm of the underlying blockchain technology. On the other hand, circulating supply can also be decreased via actions such as burning tokens, or mistakenly sending assets to addresses of other incompatible blockchains.
Market capitalization is the result of multiplying the circulating supply of a certain asset by the asset’s current market value.
Trading volume refers to the total number of tokens for a specific asset that has been transacted or exchanged between buyers and sellers within set trading hours, for example, 24 hours. It is used to gauge market sentiment, this metric combines all volumes on centralized exchanges and decentralized exchanges. Increasing trading volume often denotes the demand for a certain asset as more people are buying and selling the cryptocurrency.
Funding rates are a concept designed to encourage traders to take positions and ensure perpetual contract prices match spot markets. It defines a mechanism by exchanges to ensure that future prices and index prices periodic payments regularly converge. When the funding rate is positive, the price of the perpetual contract is higher than the mark price. This means traders who are bullish and have opened long positions pay traders who are in short positions. On the other hand, a negative funding rate means perpetual prices are below the mark price, and hence traders with short positions pay traders who have opened long positions.
Search
RECENT PRESS RELEASES
Related Post

