Top 3 Price Prediction: Bitcoin, Ethereum, Ripple – BTC, ETH and XRP show early signs of e
May 27, 2025
- Bitcoin price hovers around $108,500 on Wednesday, following a mild correction the previous day.
- Ethereum nears key resistance at $2,724, with momentum waning and correction risks rising.
- XRP hovers around its 50-day EMA; a decisive daily close below could trigger further downside.
Bitcoin (BTC) stabilized around $108,500 on Wednesday, appearing to lose steam mid-week after a sharp rally in the previous week. Ethereum (ETH) and Ripple (XRP) are following BTC’s lead near key support levels that could dictate their next moves.
Bitcoin price reached a new all-time high (ATH) of $111,980 on Thursday and declined by 3.92% on Friday. However, it found support around the $106,406 daily level on Saturday and recovered in the last three days. BTC faced a mild correction on Tuesday. At the time of writing, it trades at around $108,700.
Bitcoin momentum indicators are flashing early warning signs of potential exhaustion. The Relative Strength Index (RSI) on the daily chart reads 64, pointing downward after being rejected from its overbought level of 70, indicating fading bullish momentum. Additionally, the Moving Average Convergence Divergence (MACD) indicator also showed a bearish crossover on Sunday, giving sell signals and suggesting a downward trend.
If BTC faces a pullback, it could extend the correction to retest its daily support level at $106,406. A successful close below this level could extend the decline to revisit its psychologically important level of $100,000.
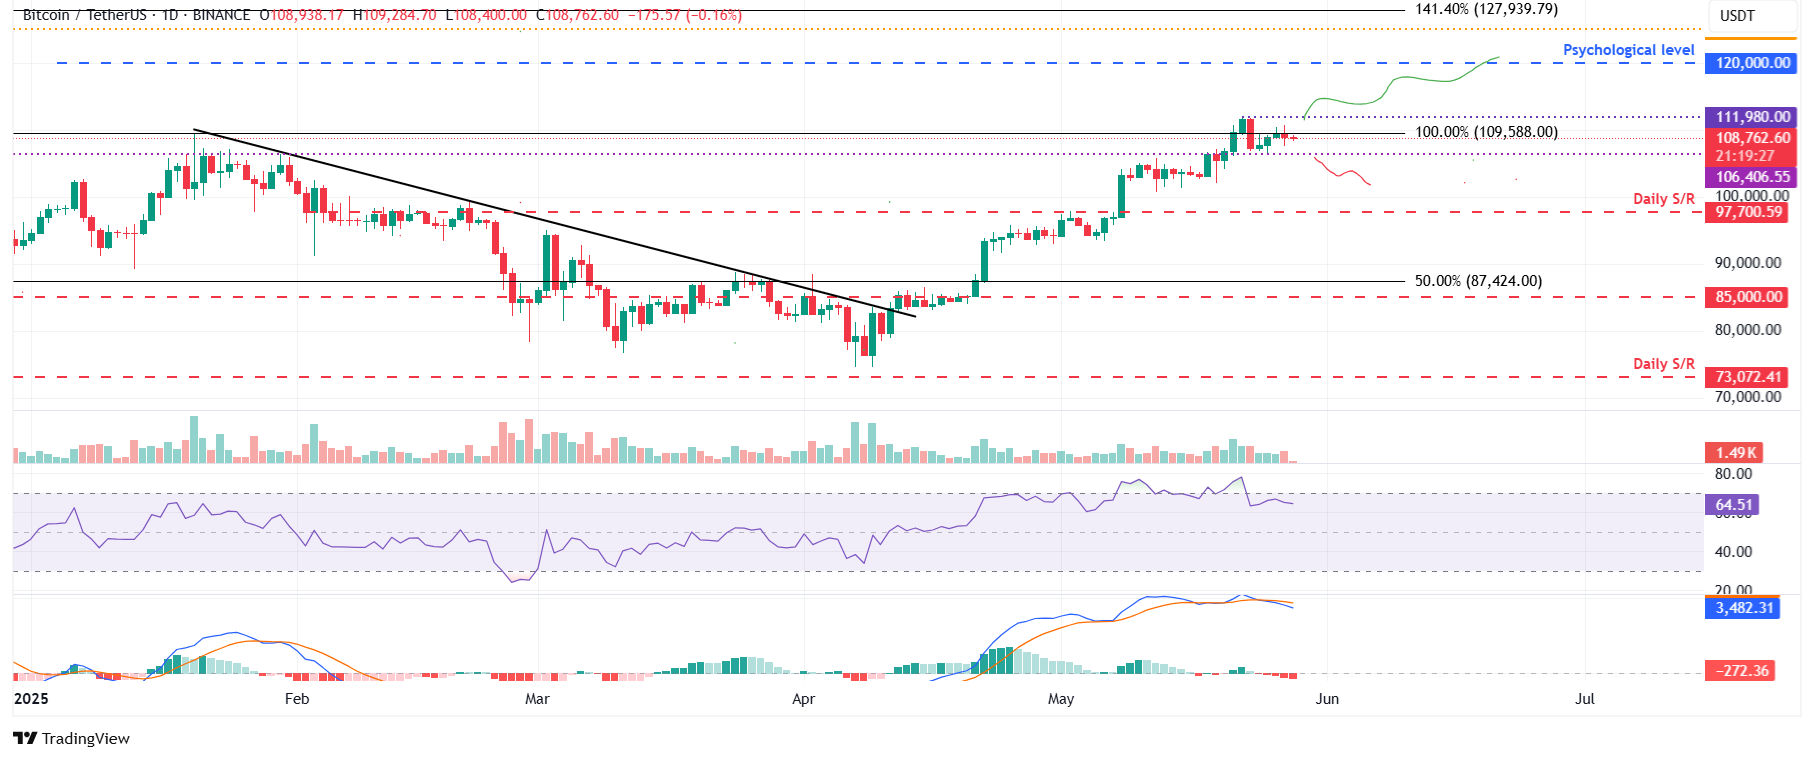
BTC/USDT daily chart
However, if BTC continues to recover and closes above its all-time high, it could extend the rally toward the key psychological level of $120,000.
Ethereum price retested and found support around its 200-day Exponential Moving Average (EMA) at $2,451 on Sunday, and it recovered 5% by Tuesday. At the time of writing on Wednesday, it trades at around $2,640, nearing its key resistance level at $2,724.
If ETH faces rejection from its daily level at $2,724 and closes below its 200-day EMA, it could extend the decline to retest its next support level at $2,247, its 50-day EMA.
The RSI on the daily chart reads 66, having been rejected from its overbought level of 70, and is pointing downward, indicating a fading bullish momentum. The MACD indicator also displayed a bearish crossover, further underscoring the weakness in momentum and indicating a potential downward trend.
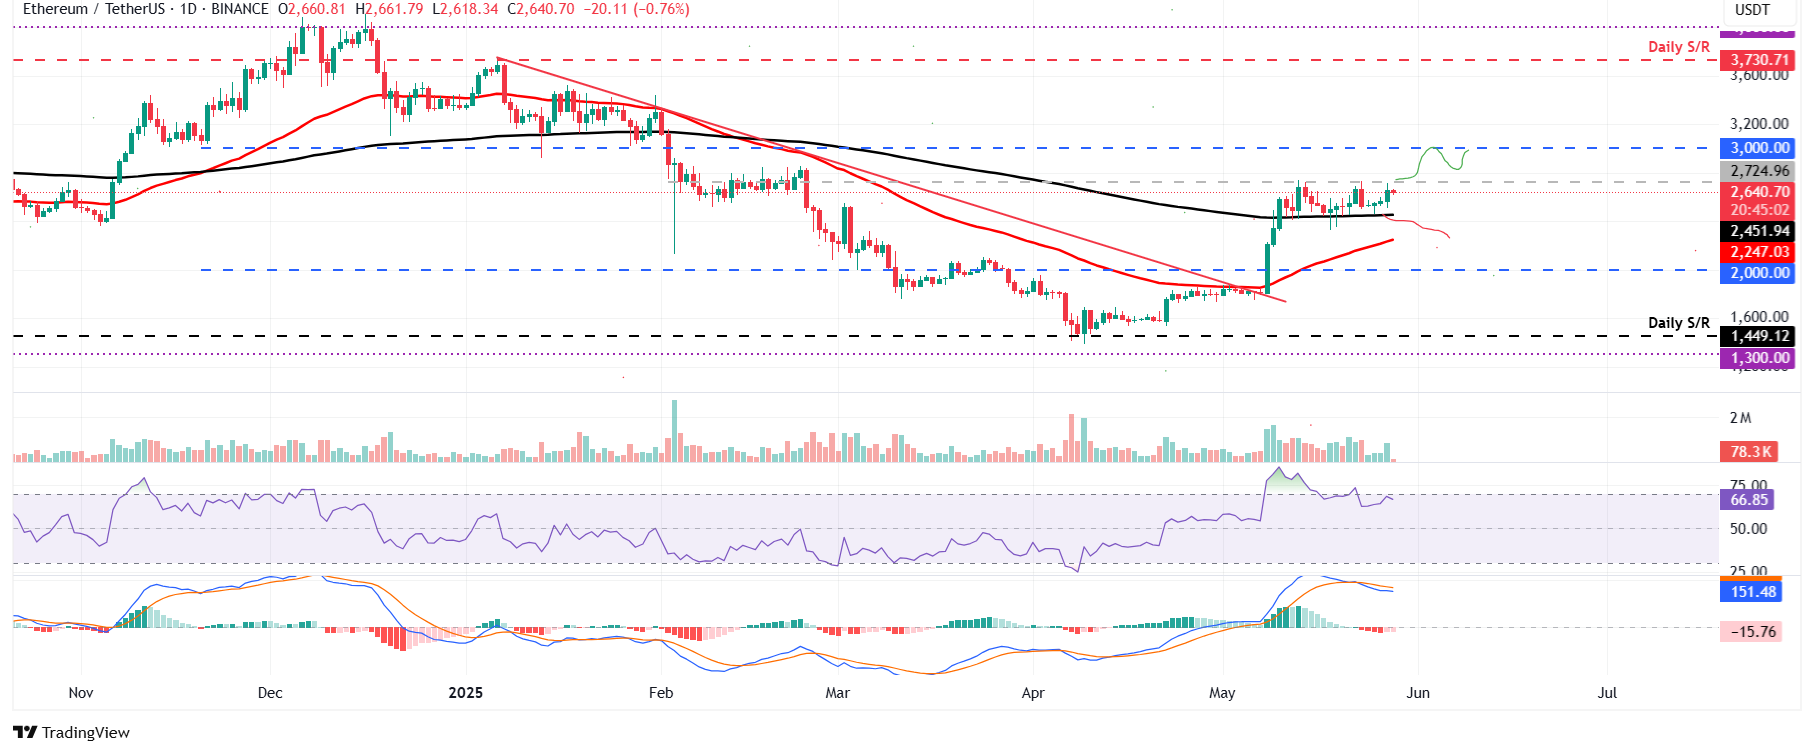
ETH/USDT daily chart
On the other hand, if ETH breaks and closes above its $2,724 resistance on a daily basis, it could extend the rally to retest its psychologically important level at $3,000.
XRP price has been consolidating around its 50-day EMA at $2.30 since Saturday. At the time of writing on Wednesday, it continues to hover around this level.
If XRP breaks below the 50-day EMA and closes below the $2.23 support level, it could extend the correction to retest its next support level at $1.96.
The RSI on the daily chart reads 48, which is below its neutral level of 50 and points downward, indicating bearish momentum. The MACD indicator also displayed a bearish crossover, further underscoring the weakness in momentum and indicating a potential downward trend.
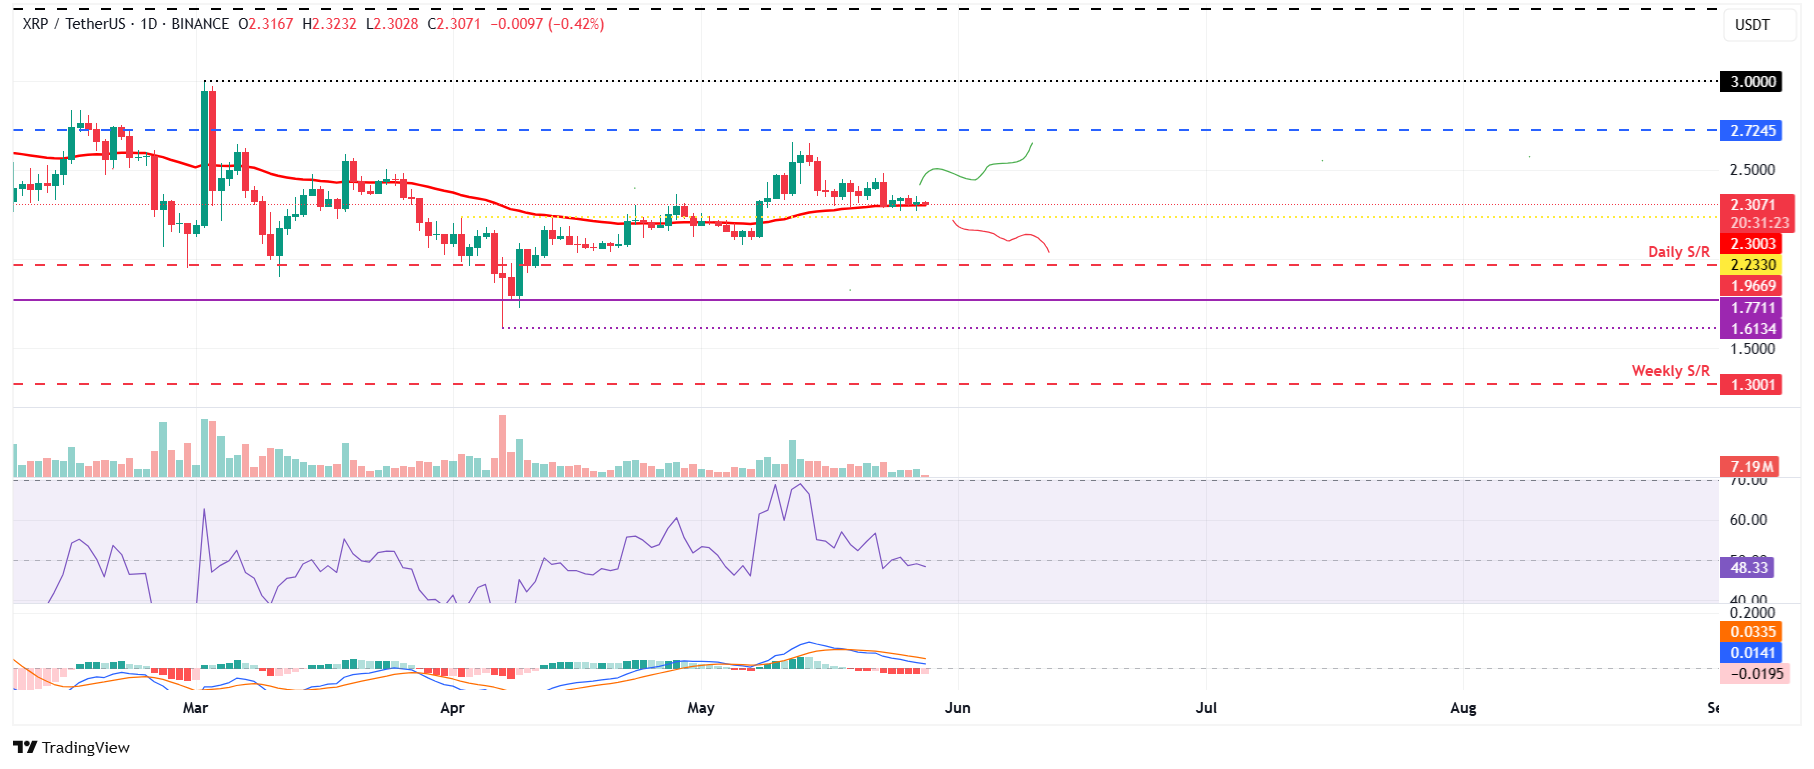
XRP/USDT daily chart
Conversely, if the 50-day EMA continues to hold as support, XRP could extend the recovery to retest its next resistance level at $2.72.
The developer or creator of each cryptocurrency decides on the total number of tokens that can be minted or issued. Only a certain number of these assets can be minted by mining, staking or other mechanisms. This is defined by the algorithm of the underlying blockchain technology. On the other hand, circulating supply can also be decreased via actions such as burning tokens, or mistakenly sending assets to addresses of other incompatible blockchains.
Market capitalization is the result of multiplying the circulating supply of a certain asset by the asset’s current market value.
Trading volume refers to the total number of tokens for a specific asset that has been transacted or exchanged between buyers and sellers within set trading hours, for example, 24 hours. It is used to gauge market sentiment, this metric combines all volumes on centralized exchanges and decentralized exchanges. Increasing trading volume often denotes the demand for a certain asset as more people are buying and selling the cryptocurrency.
Funding rates are a concept designed to encourage traders to take positions and ensure perpetual contract prices match spot markets. It defines a mechanism by exchanges to ensure that future prices and index prices periodic payments regularly converge. When the funding rate is positive, the price of the perpetual contract is higher than the mark price. This means traders who are bullish and have opened long positions pay traders who are in short positions. On the other hand, a negative funding rate means perpetual prices are below the mark price, and hence traders with short positions pay traders who have opened long positions.
Share:
Cryptos feed
Information on these pages contains forward-looking statements that involve risks and uncertainties. Markets and instruments profiled on this page are for informational purposes only and should not in any way come across as a recommendation to buy or sell in these assets. You should do your own thorough research before making any investment decisions. FXStreet does not in any way guarantee that this information is free from mistakes, errors, or material misstatements. It also does not guarantee that this information is of a timely nature. Investing in Open Markets involves a great deal of risk, including the loss of all or a portion of your investment, as well as emotional distress. All risks, losses and costs associated with investing, including total loss of principal, are your responsibility. The views and opinions expressed in this article are those of the authors and do not necessarily reflect the official policy or position of FXStreet nor its advertisers. The author will not be held responsible for information that is found at the end of links posted on this page.
If not otherwise explicitly mentioned in the body of the article, at the time of writing, the author has no position in any stock mentioned in this article and no business relationship with any company mentioned. The author has not received compensation for writing this article, other than from FXStreet.
FXStreet and the author do not provide personalized recommendations. The author makes no representations as to the accuracy, completeness, or suitability of this information. FXStreet and the author will not be liable for any errors, omissions or any losses, injuries or damages arising from this information and its display or use. Errors and omissions excepted.
The author and FXStreet are not registered investment advisors and nothing in this article is intended to be investment advice.
Search
RECENT PRESS RELEASES
Related Post


