Top 3 Price Prediction: Bitcoin, Ethereum, Ripple – BTC, ETH, and XRP steadies as improvin
September 7, 2025
- Bitcoin price stabilized around $110,900 on Monday, having recovered nearly 3% over the previous week.
- Ethereum price consolidated between $4,232 and $4,488 for the last nine days, signaling indecisiveness among traders.
- Ripple’s XRP finds support around its 100-day EMA at $2.77, eyeing a recovery ahead.
Bitcoin (BTC), Ethereum (ETH), and Ripple (XRP) are showing signs of stability as broader risk sentiment in markets improves, following a rise in expectations for a Federal Reserve (Fed) rate cut last week. BTC holds near $110,900 after a modest weekly rebound, and ETH remains rangebound within a tight consolidation zone. At the same time, XRP finds support at a key technical level, hinting at a potential recovery for these top cryptocurrencies by market capitalization.
Bitcoin price recovered nearly 3% last week after facing three consecutive weeks of pullbacks from its all-time high of $124,474. As of this week on Monday, it steadies at around $110,900.
If BTC continues its recovery, it could further extend the rally toward its daily resistance level at $116,000.
The Relative Strength Index (RSI) on the daily chart reads 46, and points upward toward its neutral level of 50, indicating that bearish momentum is fading. Moreover, the Moving Average Convergence Divergence (MACD) showed a bullish crossover on Saturday, giving buy signals and indicating improving momentum, which supports the bullish view.
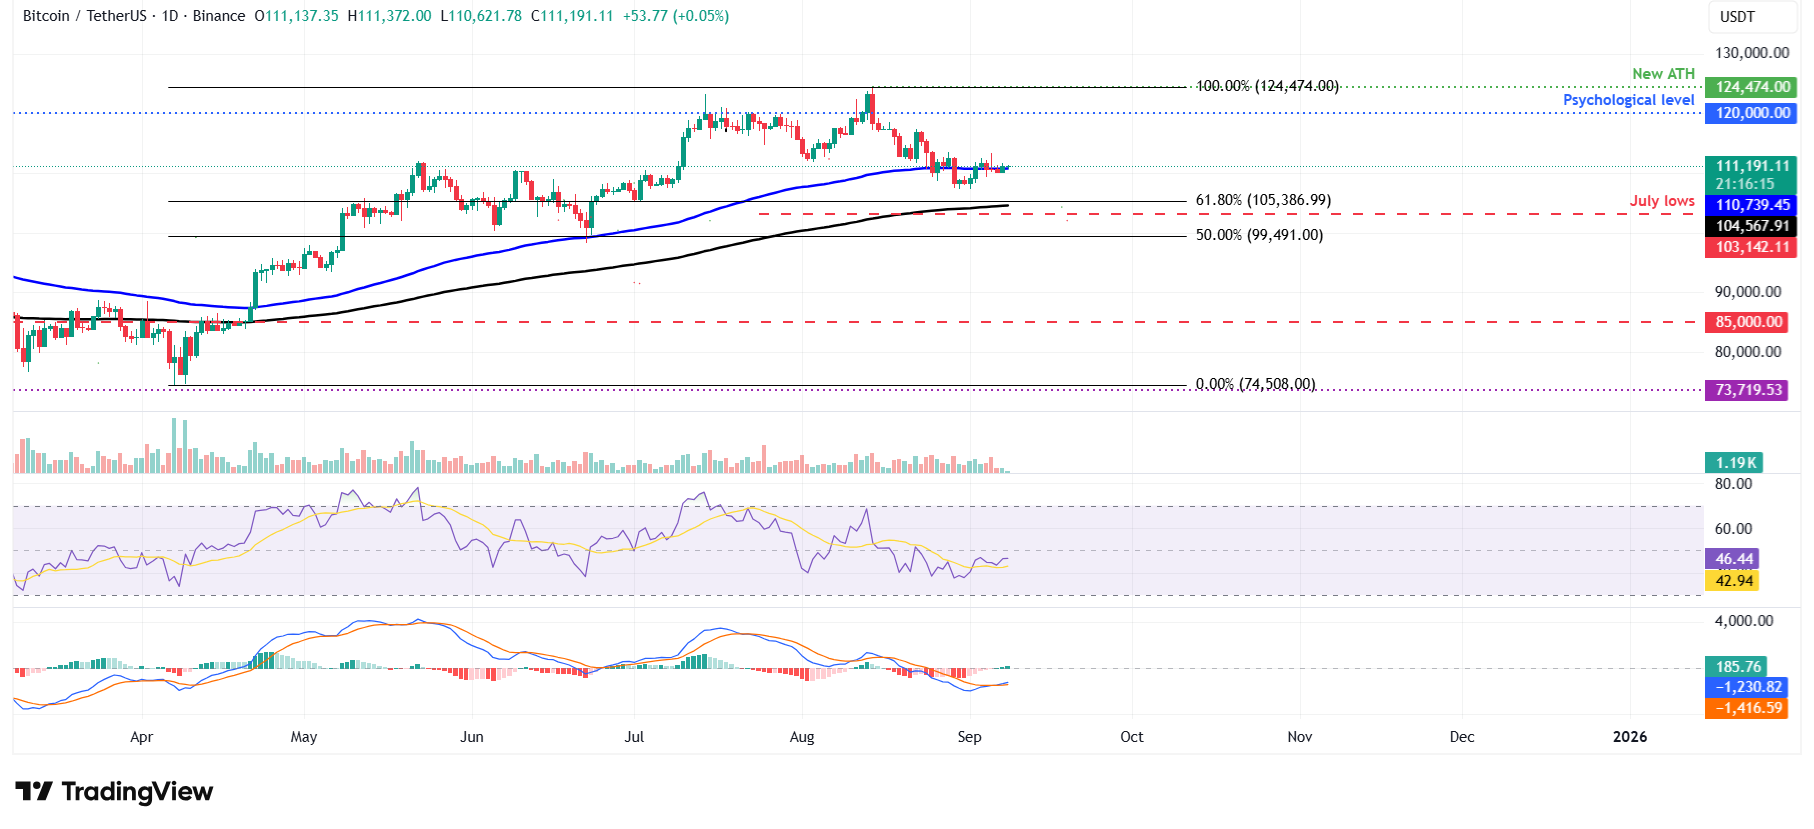
BTC/USDT daily chart
However, if BTC faces a correction, it could extend the decline toward its daily support level at $105,573.
Ethereum price has been consolidating between $4,232 and $4,488 for the last nine days. At the time of writing on Monday, it trades around $4,300 after rebounding from its lower consolidating boundary at $4,323 the previous day.
If the lower consolidation boundary at $4,232 continues to hold as support and ETH closes above $4,488 on a daily basis, it could extend the rally toward its record high at $4,956.
The RSI on the daily chart has been hovering around its neutral level of 50 since Thursday, indicating indecisiveness among traders.
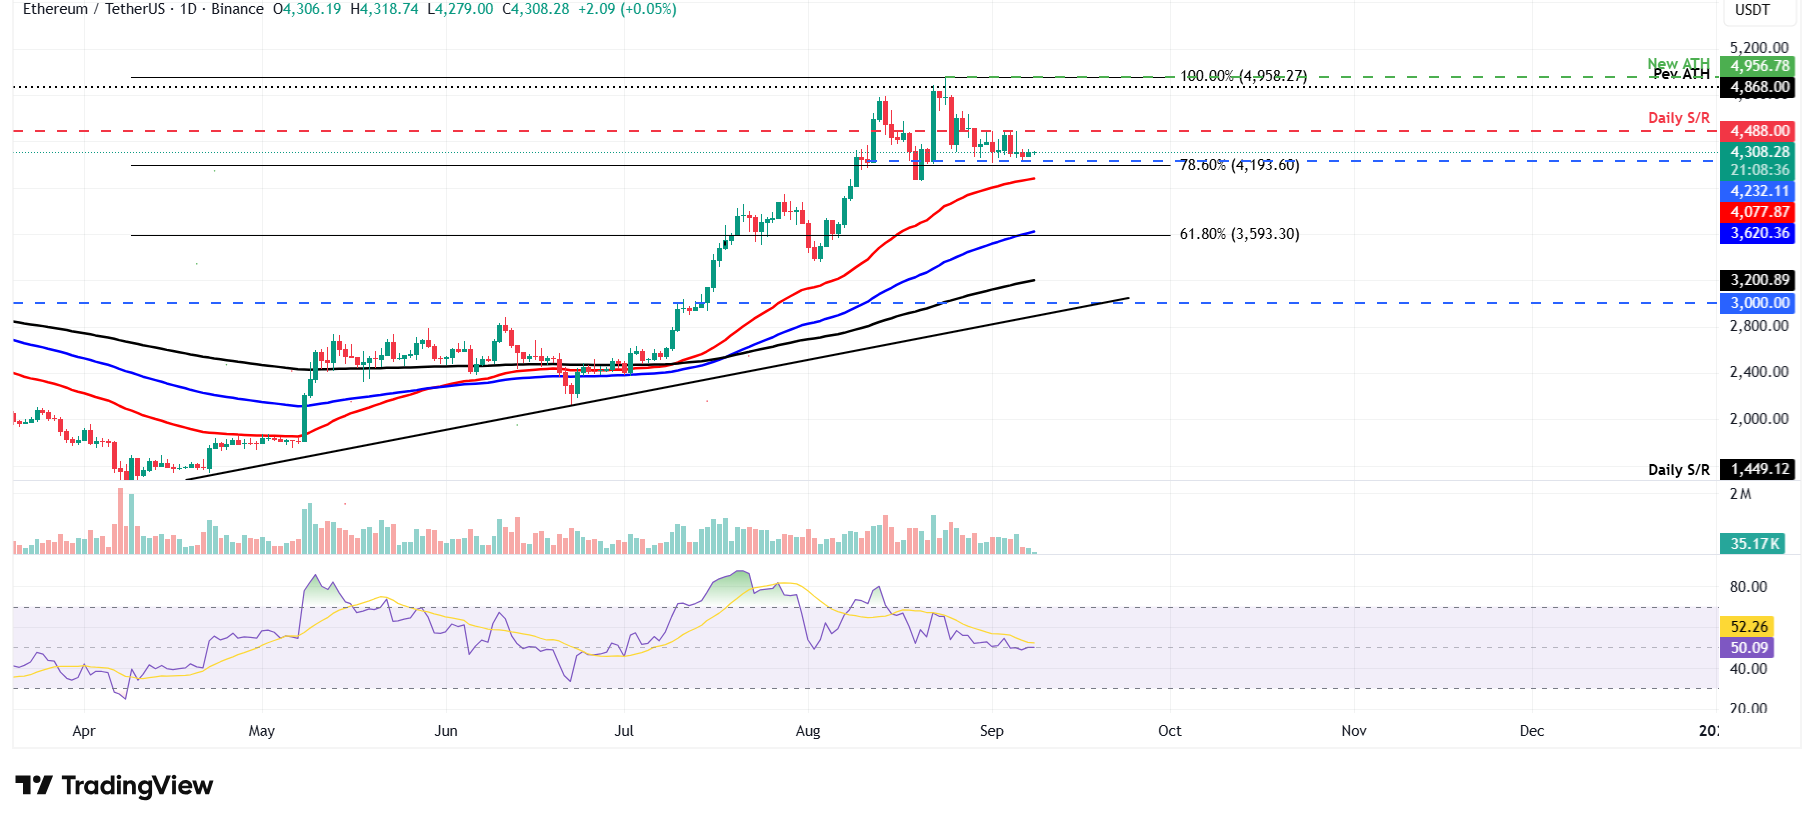
ETH/USDT daily chart
On the other hand, if ETH faces a correction and closes below the lower consolidation level at $4,232, it could extend the decline to retest its 50-day EMA at $4,077.
XRP price found support around its daily level at $2.72 on September 1 and recovered 3.65% last week. At the time of writing on Monday, it trades at around $2.88.
If XRP continues to recover, it could extend the recovery toward its 61.8% Fibonacci retracement level at $2.99.
The RSI on the daily chart reads 48 and points upward toward its neutral level of 50, indicating that bearish momentum is fading. Moreover, the Moving Average Convergence Divergence (MACD) is showing a bullish crossover on Monday, indicating improving momentum and supporting the bullish view.
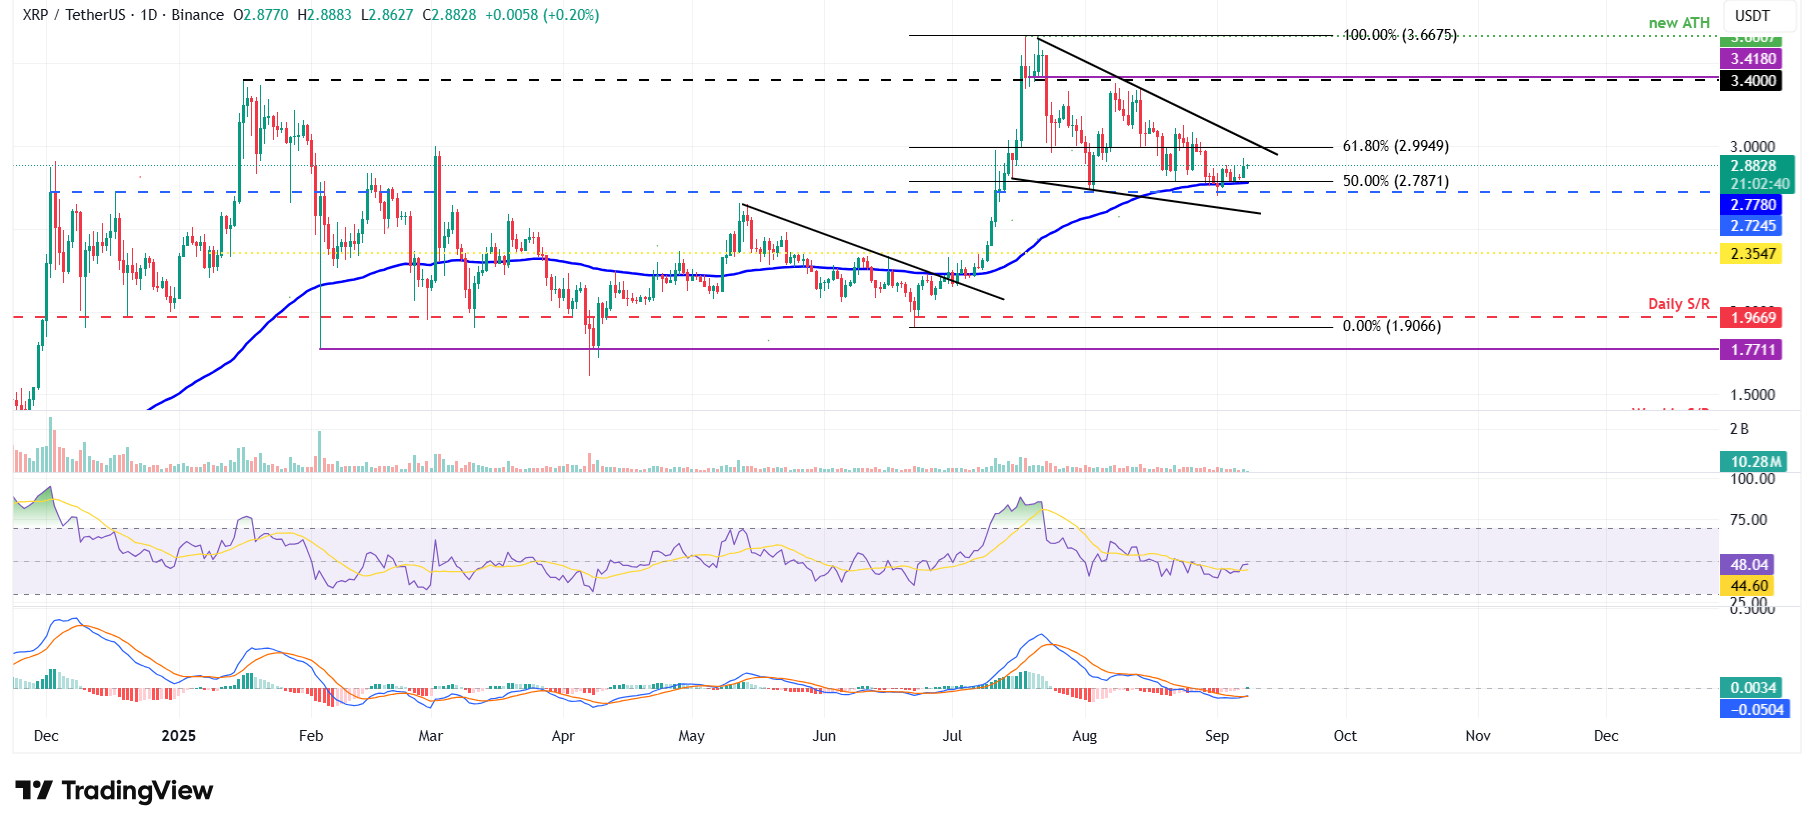
XRP/USDT daily chart
However, if XRP closes below $2.77, its 100-day EMA, it could extend the decline toward its daily support at $2.72.
The developer or creator of each cryptocurrency decides on the total number of tokens that can be minted or issued. Only a certain number of these assets can be minted by mining, staking or other mechanisms. This is defined by the algorithm of the underlying blockchain technology. On the other hand, circulating supply can also be decreased via actions such as burning tokens, or mistakenly sending assets to addresses of other incompatible blockchains.
Market capitalization is the result of multiplying the circulating supply of a certain asset by the asset’s current market value.
Trading volume refers to the total number of tokens for a specific asset that has been transacted or exchanged between buyers and sellers within set trading hours, for example, 24 hours. It is used to gauge market sentiment, this metric combines all volumes on centralized exchanges and decentralized exchanges. Increasing trading volume often denotes the demand for a certain asset as more people are buying and selling the cryptocurrency.
Funding rates are a concept designed to encourage traders to take positions and ensure perpetual contract prices match spot markets. It defines a mechanism by exchanges to ensure that future prices and index prices periodic payments regularly converge. When the funding rate is positive, the price of the perpetual contract is higher than the mark price. This means traders who are bullish and have opened long positions pay traders who are in short positions. On the other hand, a negative funding rate means perpetual prices are below the mark price, and hence traders with short positions pay traders who have opened long positions.
Information on these pages contains forward-looking statements that involve risks and uncertainties. Markets and instruments profiled on this page are for informational purposes only and should not in any way come across as a recommendation to buy or sell in these assets. You should do your own thorough research before making any investment decisions. FXStreet does not in any way guarantee that this information is free from mistakes, errors, or material misstatements. It also does not guarantee that this information is of a timely nature. Investing in Open Markets involves a great deal of risk, including the loss of all or a portion of your investment, as well as emotional distress. All risks, losses and costs associated with investing, including total loss of principal, are your responsibility. The views and opinions expressed in this article are those of the authors and do not necessarily reflect the official policy or position of FXStreet nor its advertisers. The author will not be held responsible for information that is found at the end of links posted on this page.
If not otherwise explicitly mentioned in the body of the article, at the time of writing, the author has no position in any stock mentioned in this article and no business relationship with any company mentioned. The author has not received compensation for writing this article, other than from FXStreet.
FXStreet and the author do not provide personalized recommendations. The author makes no representations as to the accuracy, completeness, or suitability of this information. FXStreet and the author will not be liable for any errors, omissions or any losses, injuries or damages arising from this information and its display or use. Errors and omissions excepted.
The author and FXStreet are not registered investment advisors and nothing in this article is intended to be investment advice.
Search
RECENT PRESS RELEASES
Related Post


