Top 3 Price Prediction: Bitcoin, Ethereum, Ripple – BTC finds footing, ETH pauses, while X
September 9, 2025
- Bitcoin price hovers around $111,000 on Wednesday after facing rejection from its 50-day EMA at $112,800.
- Ethereum consolidated between $4,232 and $4,488 for the last 12 days, signaling indecisiveness among traders.
- Ripple price trades within a falling wedge, a breakout signals a potential bullish move ahead.
Bitcoin (BTC) price holds steady around $111,000 at the time of writing on Wednesday after facing a mild rejection the previous day. Ethereum (ETH) price has been trading sideways for over a week, indicating indecisiveness among traders. Meanwhile, Ripple (XRP) shows a bullish setup; a breakout could trigger a rally ahead.
Bitcoin price extended its recovery on Monday, reaching its 50-day Exponential Moving Average (EMA) at $112,830 the following day, but faced rejection around that level. At the time of writing on Wednesday, it holds steady at around $111,000.
If BTC closes above the 50-day EMA at $112,830 on a daily basis, it could extend the rally toward its next daily resistance at $116,000.
The Relative Strength Index (RSI) reads 43 after facing rejection from its neutral level of 50 on Tuesday, indicating signs of bearish momentum. However, the Moving Average Convergence Divergence (MACD) indicator showed a bullish crossover on Saturday, providing a buy signal. Moreover, it also shows rising green histogram bars above its neutral level, indicating bullish momentum and an upward trend ahead.
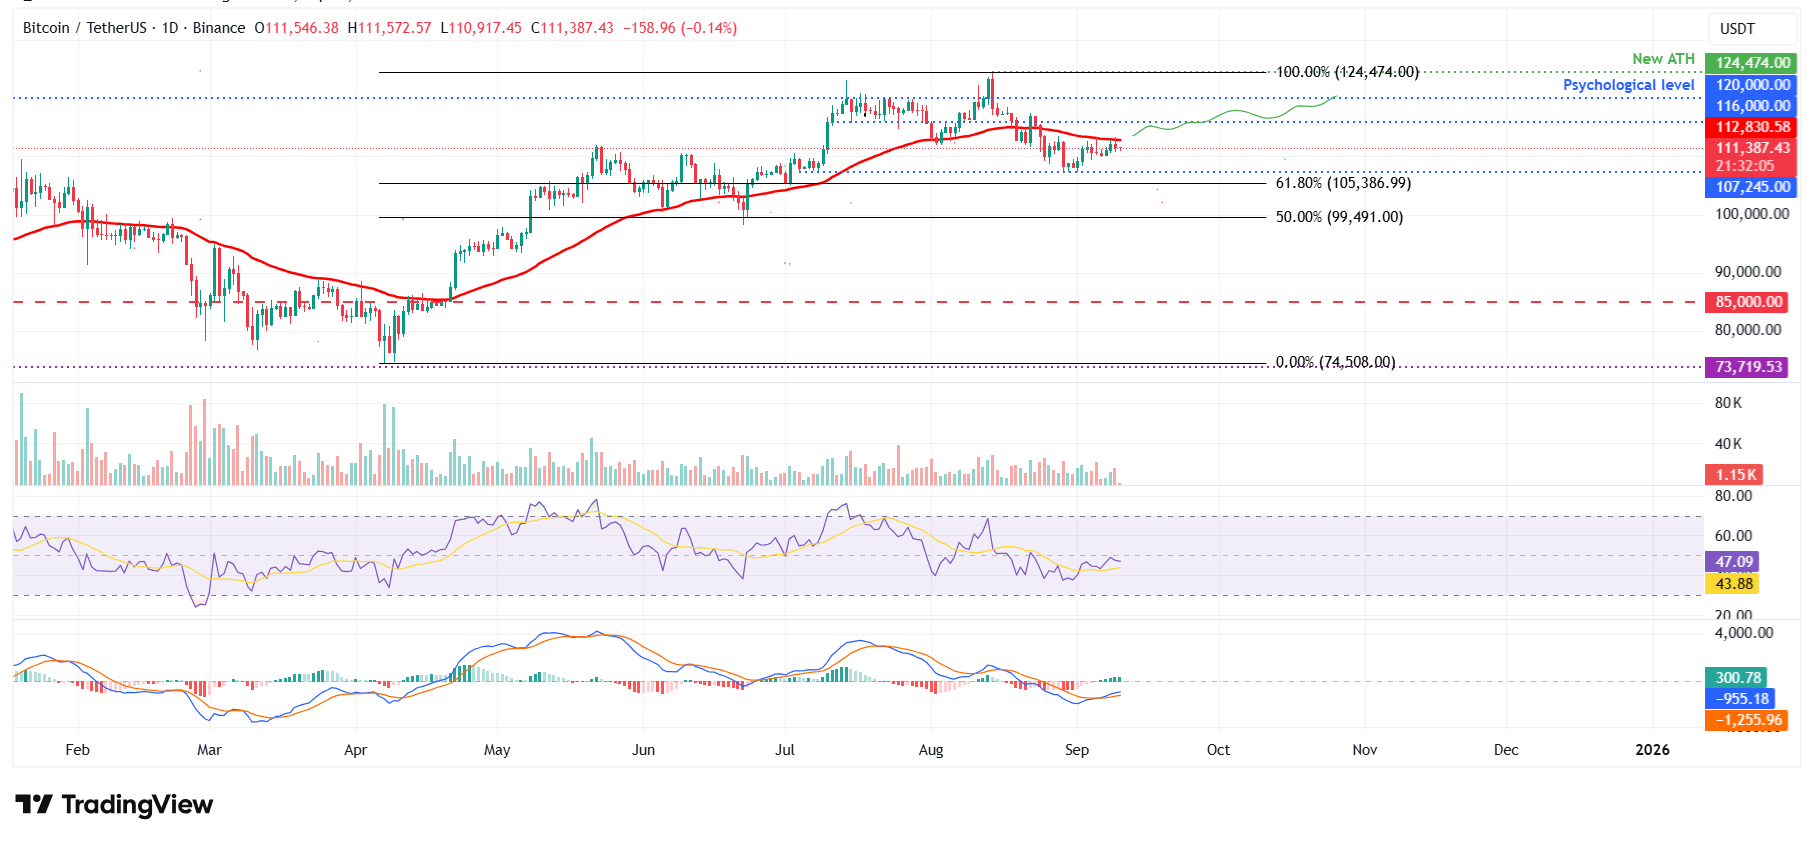
BTC/USDT daily chart
However, if BTC fails to close above its 50-day EMA at $112,830 and corrects, it could extend the decline toward its daily support at $107,245.
Ethereum price has been trading sideways between $4,232 and $4,488 for the last 12 days, since August 29. At the time of writing on Wednesday, it hovers at around $4,319.
Assuming that ETH breaks above the upper boundary at $4,488, it could extend the rally towards its record high at $4,956.
The RSI on the daily chart has been hovering around its neutral level of 50 since September 4, indicating indecisiveness among traders.
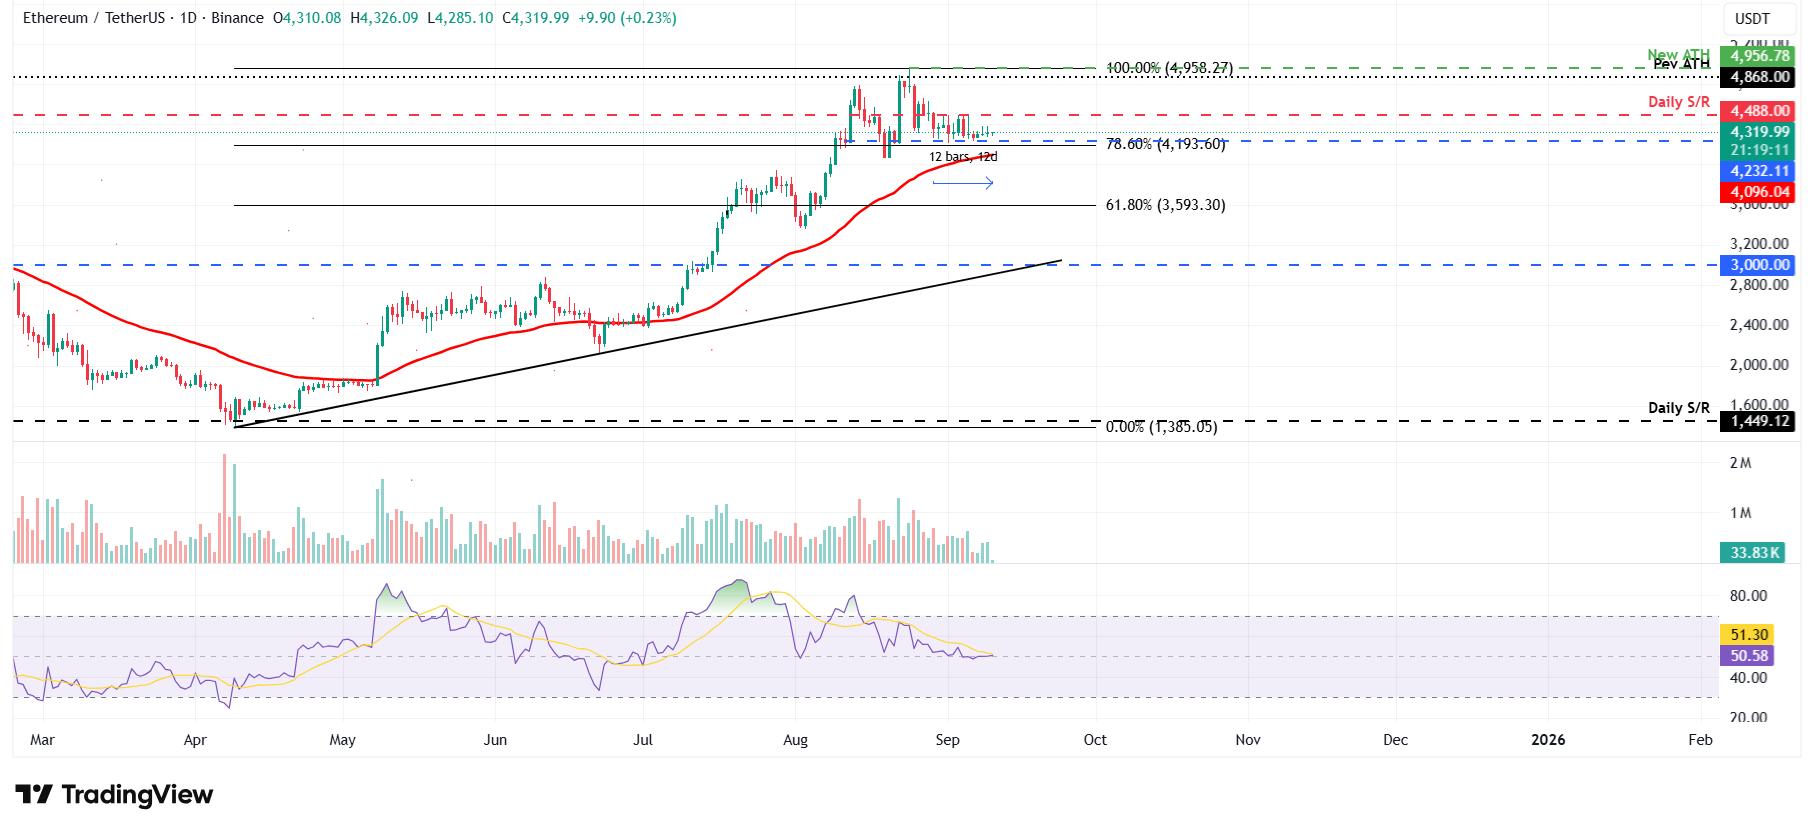
ETH/USDT daily chart
If ETH closes below the lower boundary at $4,232, it could extend the decline toward its 50-day EMA at $4,096
Ripple price trades within a falling wedge pattern (drawn by connecting multiple highs and lows with two trendlines since mid-July). At the time of writing on Wednesday, it is nearing its upper trendline boundary, and a breakout favors the bulls.
If XRP closes above the upper trendline boundary around $2.99 on a daily basis, it could extend the rally toward its daily resistance at $3.40.
The RSI on the daily chart stands at 52, having moved above its neutral level of 50, indicating early signs of bullish momentum. Additionally, the MACD showed a bullish crossover on Monday, giving buy signals and indicating improving momentum, which supports the bullish view.
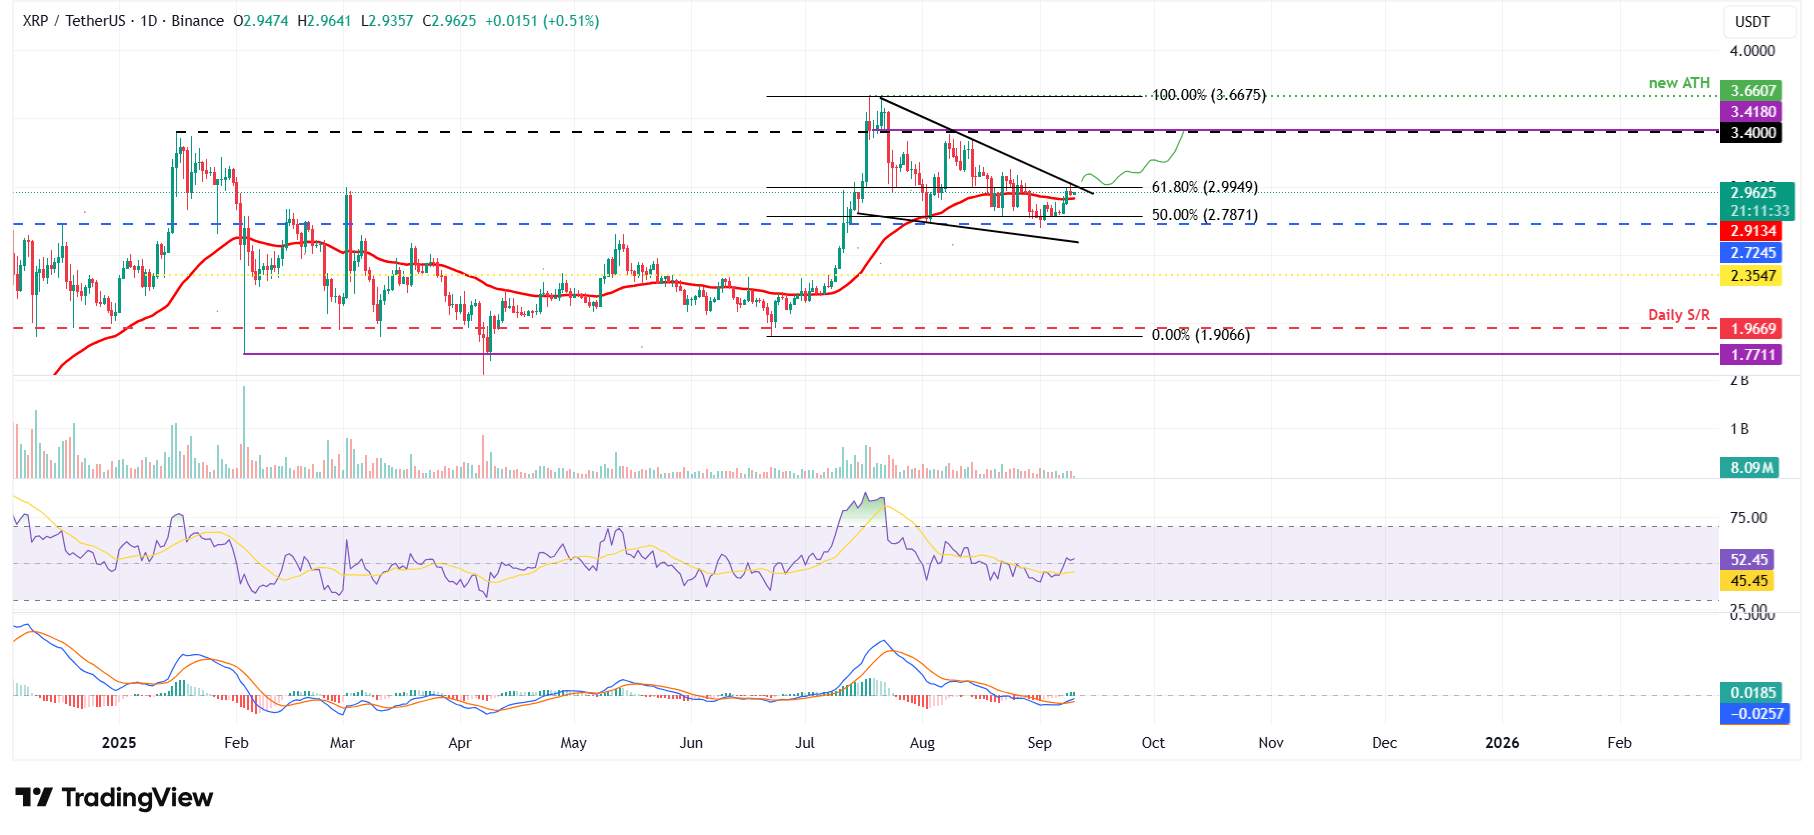
XRP/USDT daily chart
However, if XRP faces rejection from the upper trendline of the pattern, it could extend the decline toward its daily support at $2.72.
The developer or creator of each cryptocurrency decides on the total number of tokens that can be minted or issued. Only a certain number of these assets can be minted by mining, staking or other mechanisms. This is defined by the algorithm of the underlying blockchain technology. On the other hand, circulating supply can also be decreased via actions such as burning tokens, or mistakenly sending assets to addresses of other incompatible blockchains.
Market capitalization is the result of multiplying the circulating supply of a certain asset by the asset’s current market value.
Trading volume refers to the total number of tokens for a specific asset that has been transacted or exchanged between buyers and sellers within set trading hours, for example, 24 hours. It is used to gauge market sentiment, this metric combines all volumes on centralized exchanges and decentralized exchanges. Increasing trading volume often denotes the demand for a certain asset as more people are buying and selling the cryptocurrency.
Funding rates are a concept designed to encourage traders to take positions and ensure perpetual contract prices match spot markets. It defines a mechanism by exchanges to ensure that future prices and index prices periodic payments regularly converge. When the funding rate is positive, the price of the perpetual contract is higher than the mark price. This means traders who are bullish and have opened long positions pay traders who are in short positions. On the other hand, a negative funding rate means perpetual prices are below the mark price, and hence traders with short positions pay traders who have opened long positions.
Disclaimer: For information purposes only. Past performance is not indicative of future results.
Search
RECENT PRESS RELEASES
Related Post


