Top 3 Price Prediction: Bitcoin, Ethereum, Ripple – BTC slips below key support, ETH and X
May 29, 2025
- Bitcoin closes below the critical $106,400 support level, signaling the potential for a deeper correction.
- Ethereum struggles to breach the $2,724 resistance, with weakening momentum increasing downside risk.
- Ripple dips under its 50-day EMA, setting the stage for a possible pullback toward $1.96.
Bitcoin (BTC) trades below $106,000 on Friday after slipping below a crucial support level, increasing the likelihood of a deeper correction. Ethereum (ETH) faces rejection from a key level while Ripple (XRP) closes below its important support zone, both suggesting increasing downside risks in the near term.
Bitcoin price dipped and closed below its daily level of $106,406 on Thursday, following its ongoing correction over the previous two days. At the time of writing on Friday, it hovers and trades at around $105,600.
If BTC continues its correction, it could extend the decline to revisit its psychologically important level of $100,000.
The Relative Strength Index (RSI) reads 54, pointing downward toward its neutral level of 50, indicating fading bullish momentum. Additionally, the Moving Average Convergence Divergence (MACD) indicator also showed a bearish crossover. It also shows rising red histogram bars below its neutral level, indicating a correction ahead.
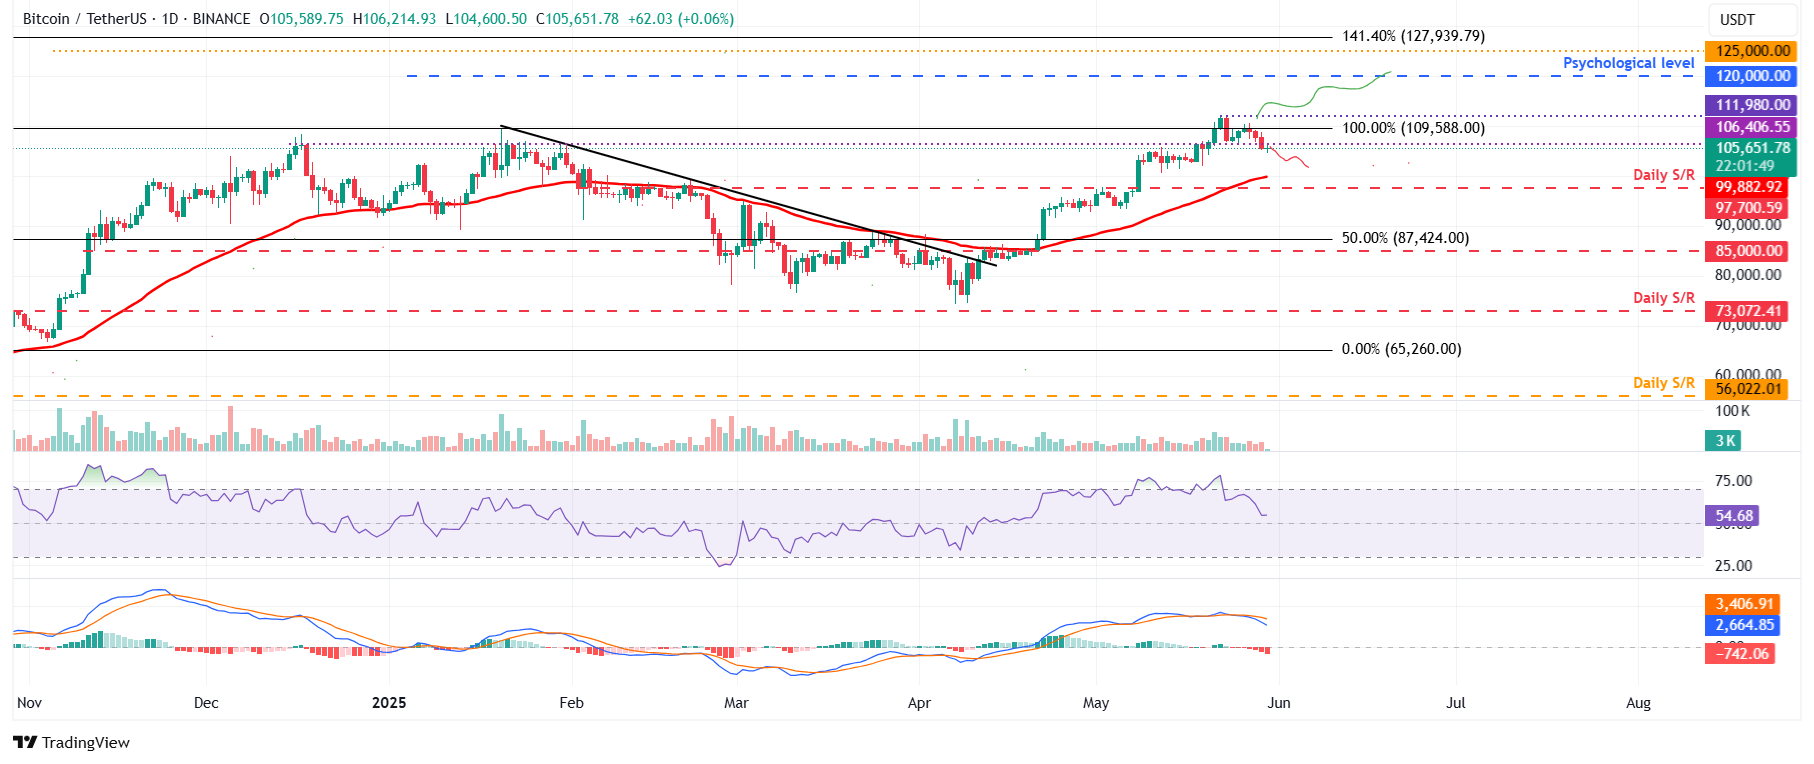
BTC/USDT daily chart
However, if BTC recovers and closes above its all-time high, it could extend the rally toward the key psychological level of $120,000.
Ethereum price faced rejection around its daily level of $2,724 on Thursday and declined slightly. At the time of writing on Friday, it continues to trade down around $2,600.
Suppose ETH continues its correction and closes below the 200-day Exponential Moving Average (EMA) at $2,455 on a daily basis. ETH could extend the decline to retest its next support level at $2,277, its 50-day EMA.
The RSI on the daily chart reads 64, having been rejected from its overbought level of 70 on Wednesday, and is pointing downward, indicating a fading bullish momentum. The MACD indicator also displayed a bearish crossover, further underscoring the weakness in momentum and indicating a potential downward trend.
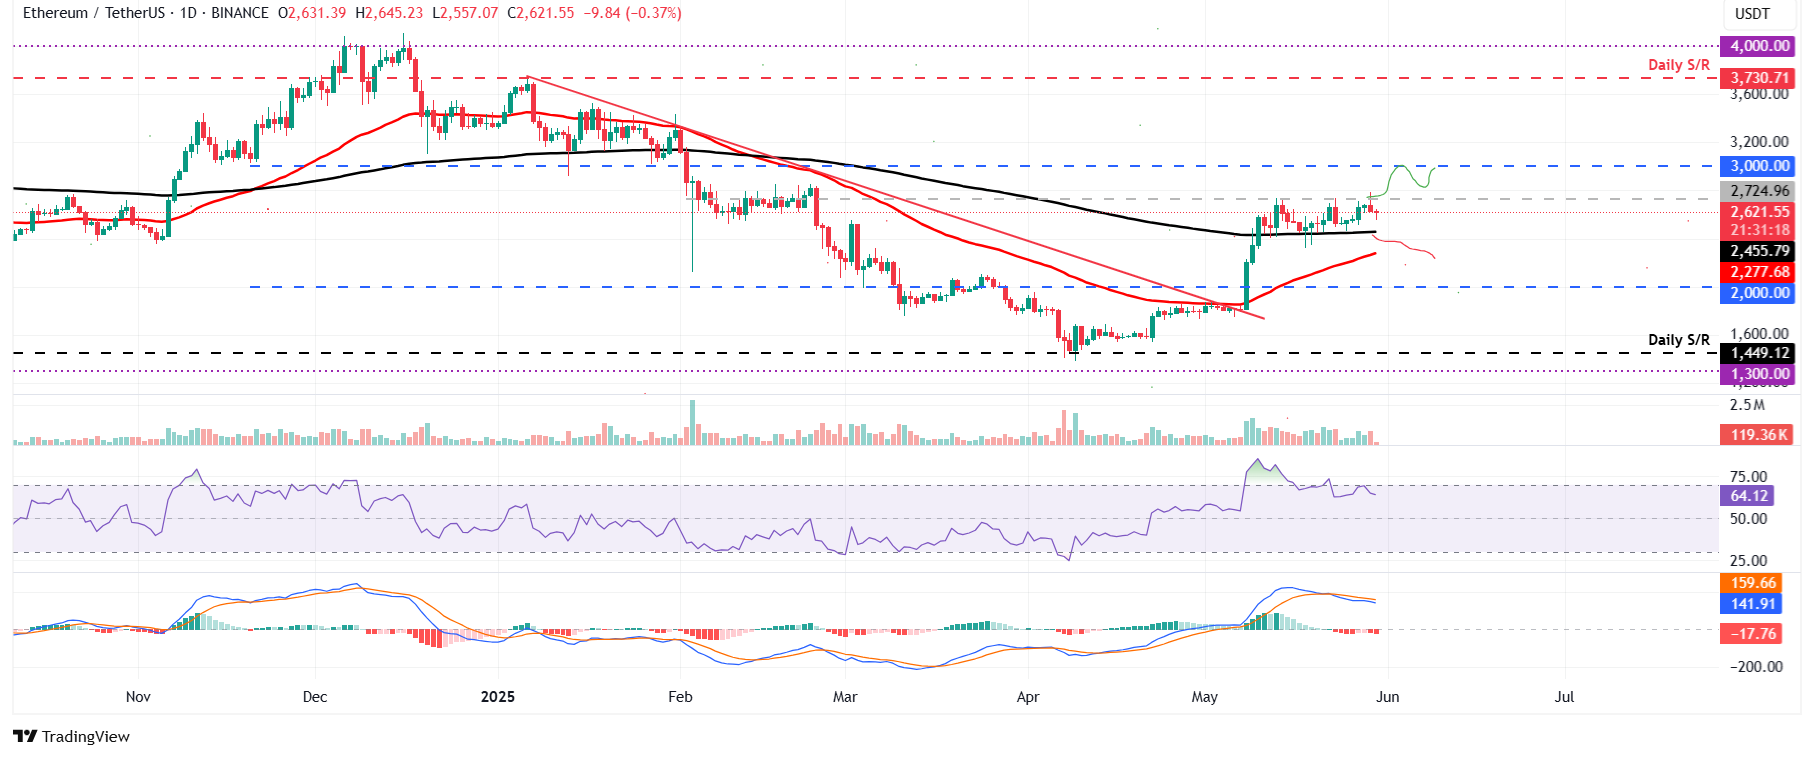
ETH/USDT daily chart
Conversely, if ETH breaks and closes above its $2,724 resistance on a daily basis, it could extend the rally to retest its psychologically important level at $3,000.
XRP price faced a pullback and closed below its 50-day EMA at $2.29 on Wednesday, declining 3% the following day. At the time of writing on Friday, it continues to trade down around $2.21.
If XRP continues its downward trend, it could extend the correction to retest its next support level at $1.96.
The RSI on the daily chart reads 41, below its neutral level of 50 and points downward, indicating strong bearish momentum. The MACD indicator also displayed a bearish crossover, further underscoring the weakness in momentum and indicating the continuation of a downward trend.
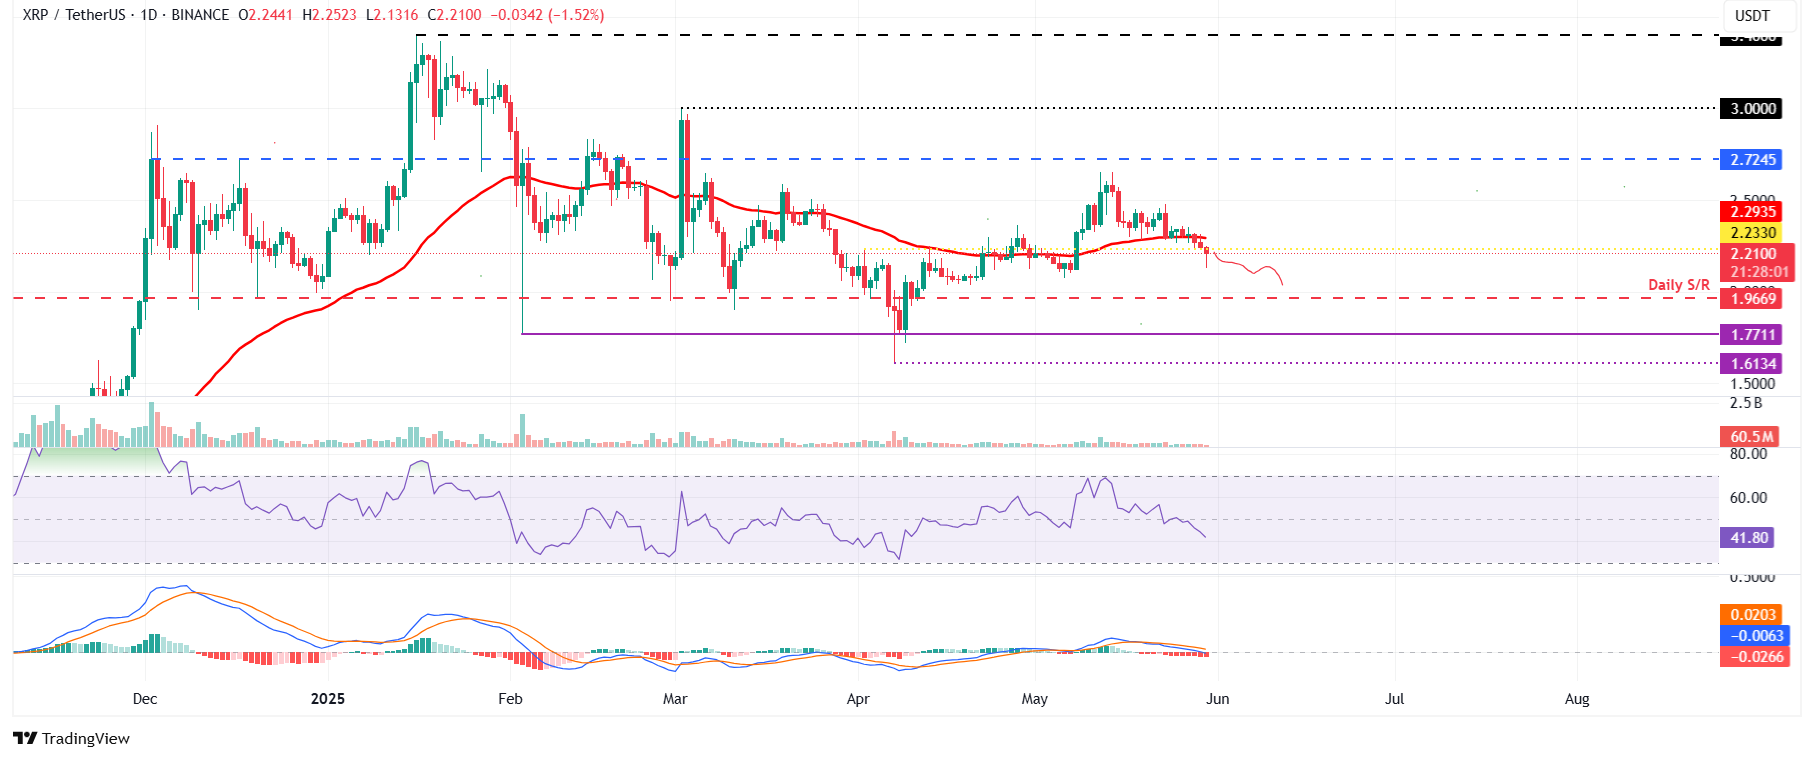
XRP/USDT daily chart
On the other hand, if XRP recovers, it could extend the recovery to retest its 50-day EMA at $2.29.
Bitcoin is the largest cryptocurrency by market capitalization, a virtual currency designed to serve as money. This form of payment cannot be controlled by any one person, group, or entity, which eliminates the need for third-party participation during financial transactions.
Altcoins are any cryptocurrency apart from Bitcoin, but some also regard Ethereum as a non-altcoin because it is from these two cryptocurrencies that forking happens. If this is true, then Litecoin is the first altcoin, forked from the Bitcoin protocol and, therefore, an “improved” version of it.
Stablecoins are cryptocurrencies designed to have a stable price, with their value backed by a reserve of the asset it represents. To achieve this, the value of any one stablecoin is pegged to a commodity or financial instrument, such as the US Dollar (USD), with its supply regulated by an algorithm or demand. The main goal of stablecoins is to provide an on/off-ramp for investors willing to trade and invest in cryptocurrencies. Stablecoins also allow investors to store value since cryptocurrencies, in general, are subject to volatility.
Bitcoin dominance is the ratio of Bitcoin’s market capitalization to the total market capitalization of all cryptocurrencies combined. It provides a clear picture of Bitcoin’s interest among investors. A high BTC dominance typically happens before and during a bull run, in which investors resort to investing in relatively stable and high market capitalization cryptocurrency like Bitcoin. A drop in BTC dominance usually means that investors are moving their capital and/or profits to altcoins in a quest for higher returns, which usually triggers an explosion of altcoin rallies.
Share:
Cryptos feed
Information on these pages contains forward-looking statements that involve risks and uncertainties. Markets and instruments profiled on this page are for informational purposes only and should not in any way come across as a recommendation to buy or sell in these assets. You should do your own thorough research before making any investment decisions. FXStreet does not in any way guarantee that this information is free from mistakes, errors, or material misstatements. It also does not guarantee that this information is of a timely nature. Investing in Open Markets involves a great deal of risk, including the loss of all or a portion of your investment, as well as emotional distress. All risks, losses and costs associated with investing, including total loss of principal, are your responsibility. The views and opinions expressed in this article are those of the authors and do not necessarily reflect the official policy or position of FXStreet nor its advertisers. The author will not be held responsible for information that is found at the end of links posted on this page.
If not otherwise explicitly mentioned in the body of the article, at the time of writing, the author has no position in any stock mentioned in this article and no business relationship with any company mentioned. The author has not received compensation for writing this article, other than from FXStreet.
FXStreet and the author do not provide personalized recommendations. The author makes no representations as to the accuracy, completeness, or suitability of this information. FXStreet and the author will not be liable for any errors, omissions or any losses, injuries or damages arising from this information and its display or use. Errors and omissions excepted.
The author and FXStreet are not registered investment advisors and nothing in this article is intended to be investment advice.
Search
RECENT PRESS RELEASES
Related Post


