Why Bitcoin Is Going Down Today? BTC Price Falls 4 Days Straight and Targets 2025 Lows at
December 16, 2025
Bitcoin (BTC)
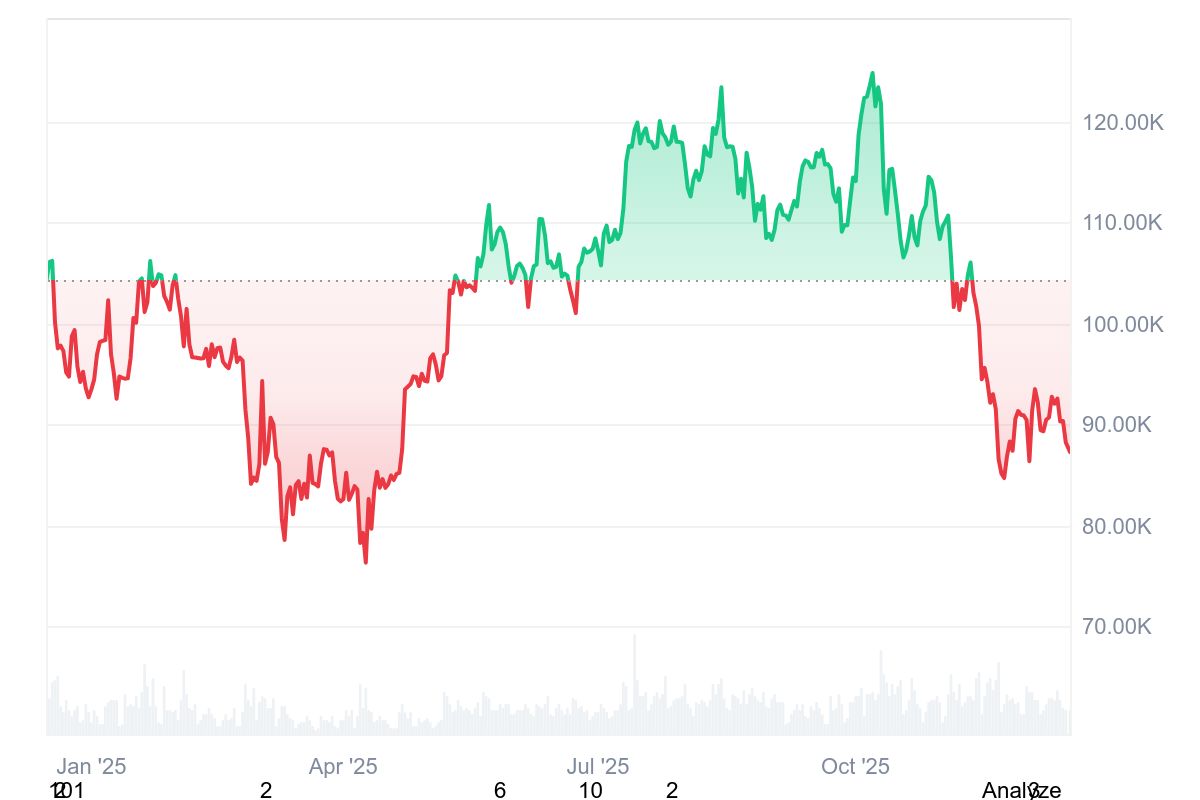
price fell to $85,266 today (Tuesday), December 16, 2025, declining 2.06% from
the previous day and extending its losing streak to four consecutive sessions.
The world’s
largest cryptocurrency has dropped 30% from its October all-time high of
$126,000 and now trades 18% below year-ago levels. This persistent weakness
comes despite the Federal Reserve’s third rate cut of 2025, as hawkish forward
guidance and elevated correlation with correcting tech stocks override
traditional liquidity narratives.
In this article, I answer the question of why Bitcoin
is going down today by analyzing the BTC/USDT chart and presenting a current
Bitcoin price outlook, drawing on my more than 10 years of experience as an
analyst and trader.
At the
moment, one Bitcoin is trading at 87,251, although the intraday lows are
clearly lower. The price has posted four consecutive declining sessions and has
moved decisively away from the 94,000 level that was still observed last week.
Federal Reserve Hawkish
Pivot Undermines Rally
The Federal
Reserve delivered its third consecutive 25-basis-point rate cut on December 10,
bringing the target range to 3.50-3.75%, the lowest in three years. However,
the central bank’s signal of a potential easing pause in 2026 has triggered
risk-off sentiment across digital assets, with Bitcoin proving particularly
vulnerable.
“From
a macro standpoint, crypto continues to trade in close alignment with
traditional risk assets, particularly U.S. equities,” Joel Kruger, crypto
strategist at LMAX, explains the macro headwinds. “Correlations remain
elevated, reinforcing bitcoin’s role as a proxy for broader risk sentiment.
Interest rates, real yields, and the U.S. dollar remain key variables for
crypto pricing.”
Ten-year
U.S. Treasury yields climbed to 4.2%, the highest since early September,
creating unfavorable conditions for non-yielding assets like Bitcoin. The
disconnect between rate cuts and rising yields reflects market concerns about
persistent inflation and fiscal sustainability, pressuring growth assets across
the board.
How Low Can BTC Price Go? Death
Cross Pattern Signals Extended Decline
Bitcoin’s
technical structure has deteriorated significantly since mid-November when the
dreaded “death cross” pattern emerged. On November 16, the 50-day
moving average crossed below the 200-day moving average while Bitcoin traded
around $93,000-$94,000. This bearish signal remains active as of December 16,
with the 50 EMA currently residing near $94,000 and the 200 EMA above $103,000.
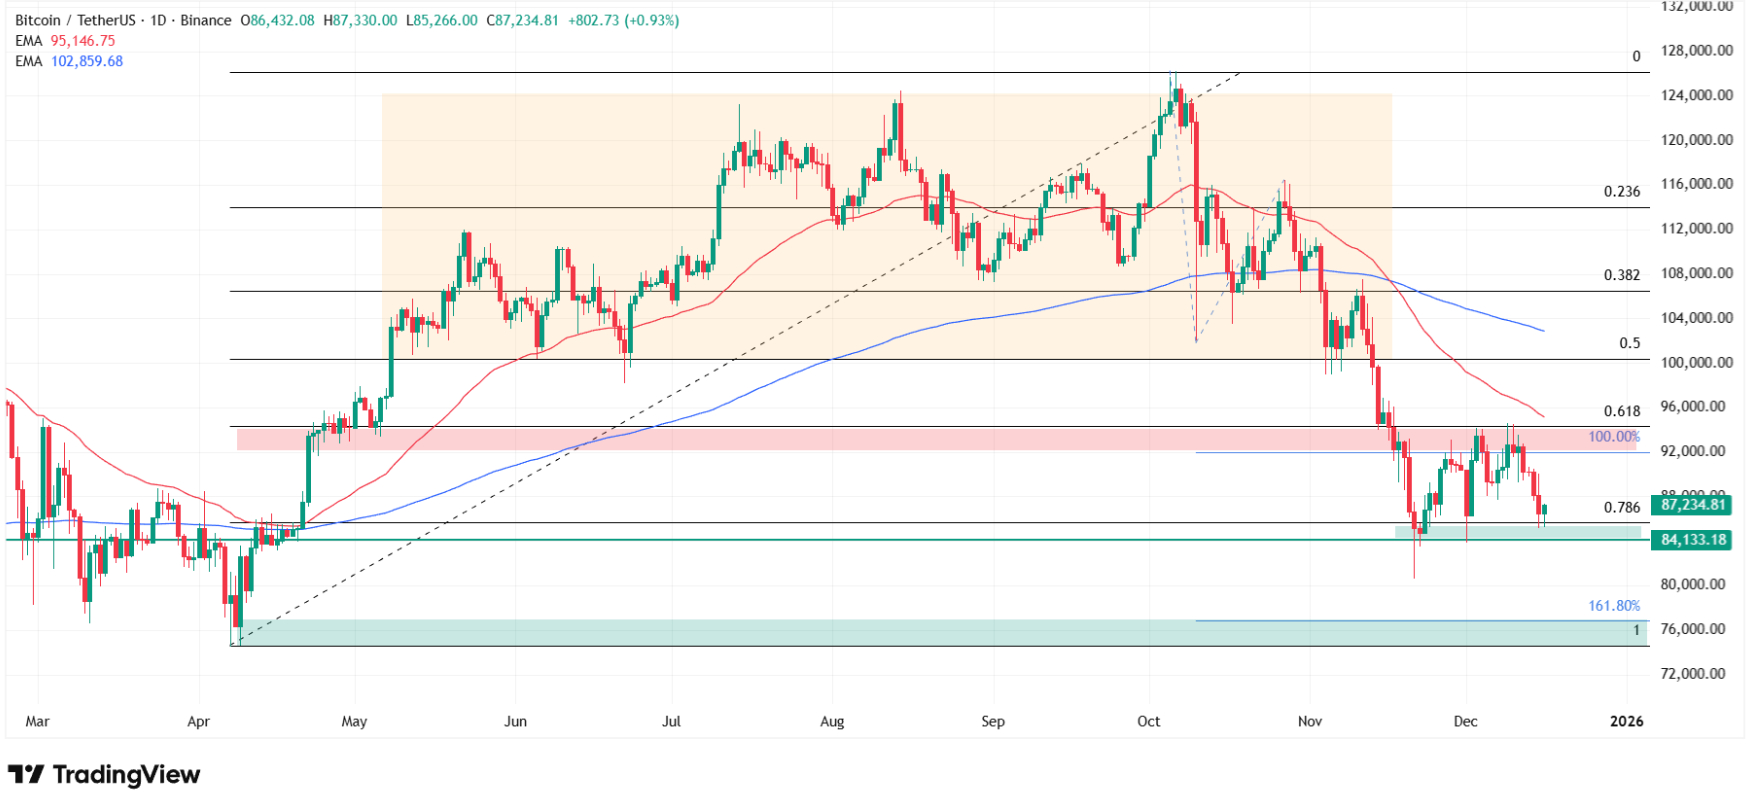
According
to my technical analysis, the price action shows Bitcoin consolidating at local
support between $84,000-$85,000, levels that coincide with lows from April,
November, and December. Recent daily data confirms the weakness: Bitcoin fell
from $92,494 on December 12 to $86,413 by December 16, testing multi-week lows.
Resistance
has formed between $92,000-$94,000, representing May highs and the 61.8%
Fibonacci retracement level where the 50 EMA acts as a ceiling. My chart
structure suggests bears maintain control, with moving averages aligned in a
bearish configuration supporting further downside.
“Bitcoin
is consolidating at multi-month lows, and the chart structure with moving
averages suggests bears have the advantage, not bulls,” Arkadiusz Jóźwiak,
Editor-in-Chief at Comparic.pl, reinforces the bearish outlook. “Although we
could move in either direction from this consolidation, I lean more toward a
downside breakout scenario moving toward April minimums.”
BTC Targets $74,000:
Capitulation Zone Ahead
Using
Fibonacci extensions, the primary technical target sits at $74,000,
representing the 161.8% extension of the recent corrective wave and coinciding
with 2025 yearly lows. This level represents an expected full capitulation zone
where weak hands exit and institutional reaccumulation begins.
Historical
data shows Bitcoin testing progressively lower levels: $90,257 on December 14,
$88,230 on December 15, and $86,413 on December 16. The critical support level
to monitor is $80,000, a sustained break below this threshold would flip market
structure decisively bearish and potentially trigger forced liquidations from
institutional treasuries and ETF holders defending their balance sheets.
BTC Year-End Dynamics and
Reversal Scenarios
Holiday
season illiquidity may extend the current consolidation between $84,000-$94,000
before the next directional move materializes. The Bank of Japan meeting on
December 19 represents a potential catalyst, as any hawkish tilt could trigger
broader currency market volatility and additional pressure on risk assets.
Kruger from
LMAX expects range-bound but volatile trading: “Looking ahead, markets are
likely to remain reactive to macroeconomic data and policy commentary this
week. Absent a clear crypto-specific catalyst, price action may remain
range-bound but volatile. Overall, bitcoin and ethereum are expected to trade
as high-beta expressions of global risk conditions.”
Despite the
bearish technical setup, my bearish scenario would be invalidated by a
sustained breakout above $94,000, where the 61.8% Fibonacci retracement and 50
EMA converge. Ultimate bullish confidence returns only with a break above
$103,000, where the 200 EMA resides, confirming the death cross reversal.
Changpeng
“CZ” Zhao, former Binance CEO, offered perspective on market cycles
via Twitter: “If you were ever jealous of people buying crypto on the
cheap, and able to hold them through the cycles, think about what they did in
moments like this.”
If you were ever jealous of people buying crypto on the cheap, and able to hold them through the cycles, think about what they did in moments like this.
— CZ 🔶 BNB (@cz_binance)
FAQ: Bitcoin Price Analysis
Questions
Why is Bitcoin falling
today?
Bitcoin is
falling due to the Federal Reserve’s hawkish 2026 guidance despite December
rate cuts, elevated correlation with correcting Nasdaq tech stocks, active
death cross pattern since November 16, and capital rotation from crypto to gold
as safe-haven preference intensifies. The 10-year Treasury yield at 4.2%
creates unfavorable conditions for non-yielding digital assets.
How low can Bitcoin go in
2025?
Technical
analysis using Fibonacci extensions identifies $74,000 as the primary target,
representing the 161.8% extension and 2025 yearly lows where full capitulation
and institutional reaccumulation is expected. Critical support sits at $80,000,
a break below triggers bearish market structure flip. Current consolidation
between $84,000-$85,000 represents April/November/December lows.
Will Bitcoin crash
further?
The bearish
scenario toward $74,000 remains probable while Bitcoin trades below $94,000
resistance and the death cross pattern stays active. Historical death cross
patterns precede extended declines, though Bitcoin must fail to bounce within
seven days of testing support to confirm another leg down. Sustained breakout
above $94,000 (50 EMA, 61.8% Fibonacci) invalidates the bearish thesis.
What is Bitcoin price
prediction for 2026?
Current
technical setup suggests capitulation at $74,000 before institutional
reaccumulation begins. Bullish reversal requires sustained breakout above
$103,000 (200 EMA) to confirm death cross invalidation and trend change.
Year-end holiday illiquidity may extend $84,000-$94,000 consolidation before
next directional move.
When will Bitcoin recover?
Sustained
breakout above $94,000 where the 50 EMA and 61.8% Fibonacci retracement
converge negates the bearish scenario. Full bullish confidence returns above
$103,000 (200 EMA), confirming death cross reversal. The Bank of Japan meeting
December 19 could provide near-term catalyst for volatility in either
direction.
Before you go, you can also check my previous Bitcoin price predictions:
Bitcoin (BTC)
price fell to $85,266 today (Tuesday), December 16, 2025, declining 2.06% from
the previous day and extending its losing streak to four consecutive sessions.
The world’s
largest cryptocurrency has dropped 30% from its October all-time high of
$126,000 and now trades 18% below year-ago levels. This persistent weakness
comes despite the Federal Reserve’s third rate cut of 2025, as hawkish forward
guidance and elevated correlation with correcting tech stocks override
traditional liquidity narratives.
In this article, I answer the question of why Bitcoin
is going down today by analyzing the BTC/USDT chart and presenting a current
Bitcoin price outlook, drawing on my more than 10 years of experience as an
analyst and trader.
At the
moment, one Bitcoin is trading at 87,251, although the intraday lows are
clearly lower. The price has posted four consecutive declining sessions and has
moved decisively away from the 94,000 level that was still observed last week.
Federal Reserve Hawkish
Pivot Undermines Rally
The Federal
Reserve delivered its third consecutive 25-basis-point rate cut on December 10,
bringing the target range to 3.50-3.75%, the lowest in three years. However,
the central bank’s signal of a potential easing pause in 2026 has triggered
risk-off sentiment across digital assets, with Bitcoin proving particularly
vulnerable.
“From
a macro standpoint, crypto continues to trade in close alignment with
traditional risk assets, particularly U.S. equities,” Joel Kruger, crypto
strategist at LMAX, explains the macro headwinds. “Correlations remain
elevated, reinforcing bitcoin’s role as a proxy for broader risk sentiment.
Interest rates, real yields, and the U.S. dollar remain key variables for
crypto pricing.”
Ten-year
U.S. Treasury yields climbed to 4.2%, the highest since early September,
creating unfavorable conditions for non-yielding assets like Bitcoin. The
disconnect between rate cuts and rising yields reflects market concerns about
persistent inflation and fiscal sustainability, pressuring growth assets across
the board.
How Low Can BTC Price Go? Death
Cross Pattern Signals Extended Decline
Bitcoin’s
technical structure has deteriorated significantly since mid-November when the
dreaded “death cross” pattern emerged. On November 16, the 50-day
moving average crossed below the 200-day moving average while Bitcoin traded
around $93,000-$94,000. This bearish signal remains active as of December 16,
with the 50 EMA currently residing near $94,000 and the 200 EMA above $103,000.
According
to my technical analysis, the price action shows Bitcoin consolidating at local
support between $84,000-$85,000, levels that coincide with lows from April,
November, and December. Recent daily data confirms the weakness: Bitcoin fell
from $92,494 on December 12 to $86,413 by December 16, testing multi-week lows.
Resistance
has formed between $92,000-$94,000, representing May highs and the 61.8%
Fibonacci retracement level where the 50 EMA acts as a ceiling. My chart
structure suggests bears maintain control, with moving averages aligned in a
bearish configuration supporting further downside.
“Bitcoin
is consolidating at multi-month lows, and the chart structure with moving
averages suggests bears have the advantage, not bulls,” Arkadiusz Jóźwiak,
Editor-in-Chief at Comparic.pl, reinforces the bearish outlook. “Although we
could move in either direction from this consolidation, I lean more toward a
downside breakout scenario moving toward April minimums.”
BTC Targets $74,000:
Capitulation Zone Ahead
Using
Fibonacci extensions, the primary technical target sits at $74,000,
representing the 161.8% extension of the recent corrective wave and coinciding
with 2025 yearly lows. This level represents an expected full capitulation zone
where weak hands exit and institutional reaccumulation begins.
Historical
data shows Bitcoin testing progressively lower levels: $90,257 on December 14,
$88,230 on December 15, and $86,413 on December 16. The critical support level
to monitor is $80,000, a sustained break below this threshold would flip market
structure decisively bearish and potentially trigger forced liquidations from
institutional treasuries and ETF holders defending their balance sheets.
BTC Year-End Dynamics and
Reversal Scenarios
Holiday
season illiquidity may extend the current consolidation between $84,000-$94,000
before the next directional move materializes. The Bank of Japan meeting on
December 19 represents a potential catalyst, as any hawkish tilt could trigger
broader currency market volatility and additional pressure on risk assets.
Kruger from
LMAX expects range-bound but volatile trading: “Looking ahead, markets are
likely to remain reactive to macroeconomic data and policy commentary this
week. Absent a clear crypto-specific catalyst, price action may remain
range-bound but volatile. Overall, bitcoin and ethereum are expected to trade
as high-beta expressions of global risk conditions.”
Despite the
bearish technical setup, my bearish scenario would be invalidated by a
sustained breakout above $94,000, where the 61.8% Fibonacci retracement and 50
EMA converge. Ultimate bullish confidence returns only with a break above
$103,000, where the 200 EMA resides, confirming the death cross reversal.
Changpeng
“CZ” Zhao, former Binance CEO, offered perspective on market cycles
via Twitter: “If you were ever jealous of people buying crypto on the
cheap, and able to hold them through the cycles, think about what they did in
moments like this.”
If you were ever jealous of people buying crypto on the cheap, and able to hold them through the cycles, think about what they did in moments like this.
— CZ 🔶 BNB (@cz_binance)
FAQ: Bitcoin Price Analysis
Questions
Why is Bitcoin falling
today?
Bitcoin is
falling due to the Federal Reserve’s hawkish 2026 guidance despite December
rate cuts, elevated correlation with correcting Nasdaq tech stocks, active
death cross pattern since November 16, and capital rotation from crypto to gold
as safe-haven preference intensifies. The 10-year Treasury yield at 4.2%
creates unfavorable conditions for non-yielding digital assets.
How low can Bitcoin go in
2025?
Technical
analysis using Fibonacci extensions identifies $74,000 as the primary target,
representing the 161.8% extension and 2025 yearly lows where full capitulation
and institutional reaccumulation is expected. Critical support sits at $80,000,
a break below triggers bearish market structure flip. Current consolidation
between $84,000-$85,000 represents April/November/December lows.
Will Bitcoin crash
further?
The bearish
scenario toward $74,000 remains probable while Bitcoin trades below $94,000
resistance and the death cross pattern stays active. Historical death cross
patterns precede extended declines, though Bitcoin must fail to bounce within
seven days of testing support to confirm another leg down. Sustained breakout
above $94,000 (50 EMA, 61.8% Fibonacci) invalidates the bearish thesis.
What is Bitcoin price
prediction for 2026?
Current
technical setup suggests capitulation at $74,000 before institutional
reaccumulation begins. Bullish reversal requires sustained breakout above
$103,000 (200 EMA) to confirm death cross invalidation and trend change.
Year-end holiday illiquidity may extend $84,000-$94,000 consolidation before
next directional move.
When will Bitcoin recover?
Sustained
breakout above $94,000 where the 50 EMA and 61.8% Fibonacci retracement
converge negates the bearish scenario. Full bullish confidence returns above
$103,000 (200 EMA), confirming death cross reversal. The Bank of Japan meeting
December 19 could provide near-term catalyst for volatility in either
direction.
Before you go, you can also check my previous Bitcoin price predictions:
Search
RECENT PRESS RELEASES
Global Energy Transition Investment Grew in 2025 Despite Major Obstacles; Here Are the Nu
SWI Editorial Staff2026-01-29T07:11:24-08:00January 29, 2026|
Global Energy Transition Investment Grew in 2025 Despite Major Obstacles; Here Are the Nu
SWI Editorial Staff2026-01-29T07:11:00-08:00January 29, 2026|
Global Energy Transition Investment Grew in 2025 Despite Major Obstacles; Here Are the Nu
SWI Editorial Staff2026-01-29T07:11:00-08:00January 29, 2026|
Global Energy Transition Investment Grew in 2025 Despite Major Obstacles; Here Are the Nu
SWI Editorial Staff2026-01-29T07:11:00-08:00January 29, 2026|
Global Energy Transition Investment Grew in 2025 Despite Major Obstacles; Here Are the Nu
SWI Editorial Staff2026-01-29T07:10:35-08:00January 29, 2026|
To Lower Electricity Costs, Consumers Quietly Install DIY Solar
SWI Editorial Staff2026-01-29T07:09:45-08:00January 29, 2026|
Related Post


