Why Crypto Is Going Down? Bitcoin, XRP, Ethereum and Dogecoin Prices Crash as Market Loses
November 5, 2025
The
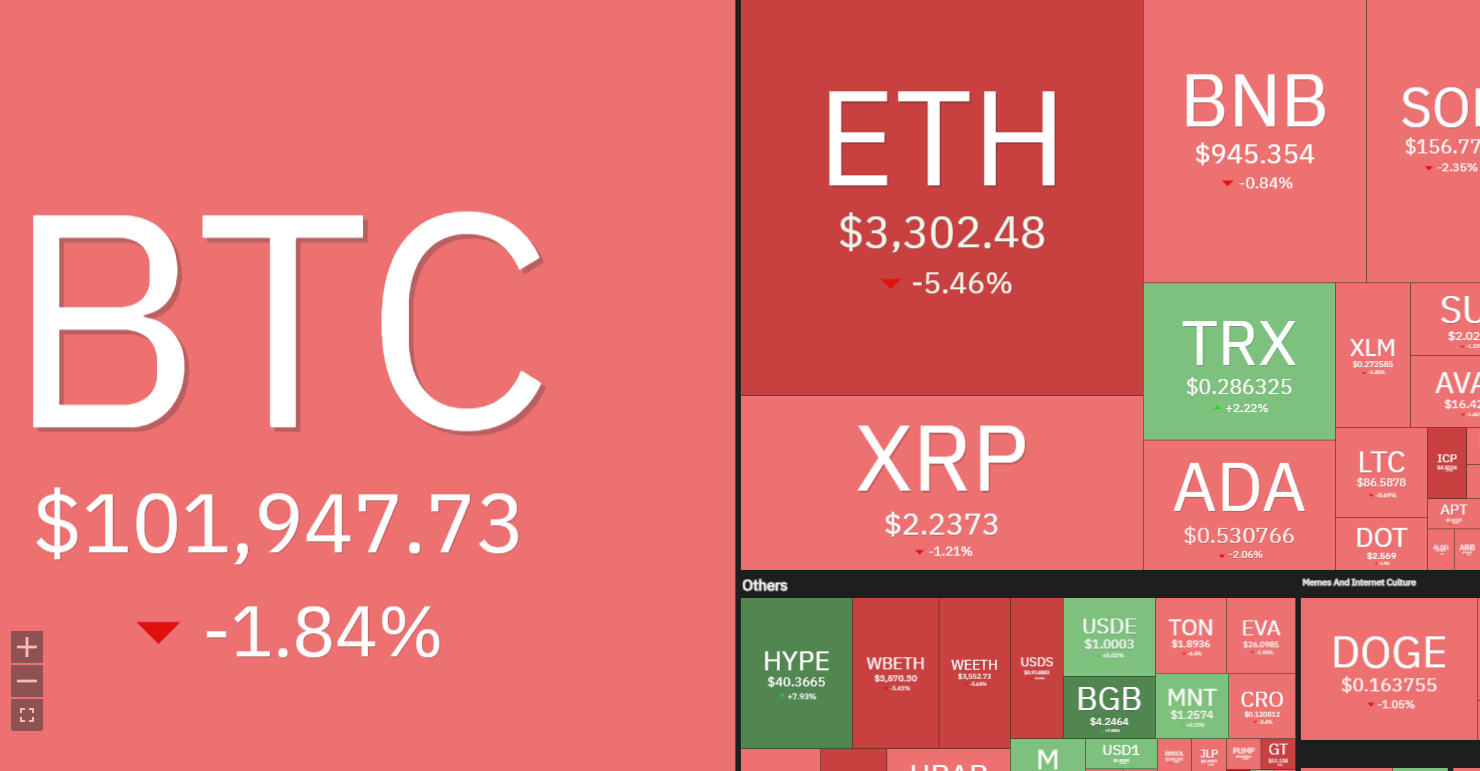
cryptocurrency market crashed for a second consecutive day today (Wednesday), 5
November 2025, losing over $1 trillion in market capitalization since early
October as Bitcoin, Ethereum, XRP and Dogecoin prices led a broad-based
selloff.
The entire
crypto ecosystem is experiencing dynamic declines with Ethereum at $3,303 (after
-16% two-day crash), Bitcoin testing $100,000 psychological support, and major
altcoins extending losses as institutional investors rotate out of digital
assets.
In this
article, I examine why crypto is going down and conduct a technical analysis of
the BTC/USDT, XRP/USDT, ETH/USDT and DOGE/USDT charts, based on more than 10
years of experience as a cryptocurrency investor and analyst.
Federal
Reserve Chairman Jerome Powell’s hawkish remarks downplaying December rate cuts
created the initial catalyst for crypto’s collapse. The probability of a
December cut collapsed from 96% before Powell’s press conference to just 69.3%
afterward, dampening expectations for looser financial conditions that
typically support cryptocurrency prices.
Paul Howard
from Wincent explained the market dynamics: “Cryptocurrency prices
continued to slide and were pushed lower by a lack of positive macro news.
There appears to be a big skew of selling on a major exchange which would back
up the on-chain analysis indicating this is old BTC whale selling pressure.
Dumping billions gradually into the ecosystem over the course of the last few
days is not panic selling.”
The
cryptocurrency collapse coincides with a broader tech selloff. Palantir dropped
8% despite beating earnings on valuation concerns, while Nvidia shed 4% losing
$200 billion in market capitalization. The Nasdaq fell 2% and the S&P 500
declined 1.2%, reflecting growing worries about AI-driven stock valuations.
Institutional
investors pulled $1.15 billion from Bitcoin ETFs last week, led by BlackRock,
ARK Invest, and Fidelity. This exodus signals a significant shift in sentiment
as traditional financial institutions that drove Bitcoin’s rally to $126,000 in
early October are now reducing exposure amid Federal Reserve uncertainty and AI
bubble concerns.
Ethereum 16% Two-Day Crash
Breaks 200-Day EMA
According
to my technical analysis, the price of Ethereum (ETH) has experienced two days
of dynamic declines in a row, losing approximately 16% within 48 hours. For the
chart situation, this is a very large change, and from my technical analysis,
these declines from the first part of the week fully hand power to the bears,
changing the trend currently to downward.
Most
significantly, we went below the 200-day exponential moving average (200 EMA),
simultaneously breaking out of the consolidation range drawn since July, and
also went below the zone of August lows, leaving behind a series of very
important supports which are now resistance.
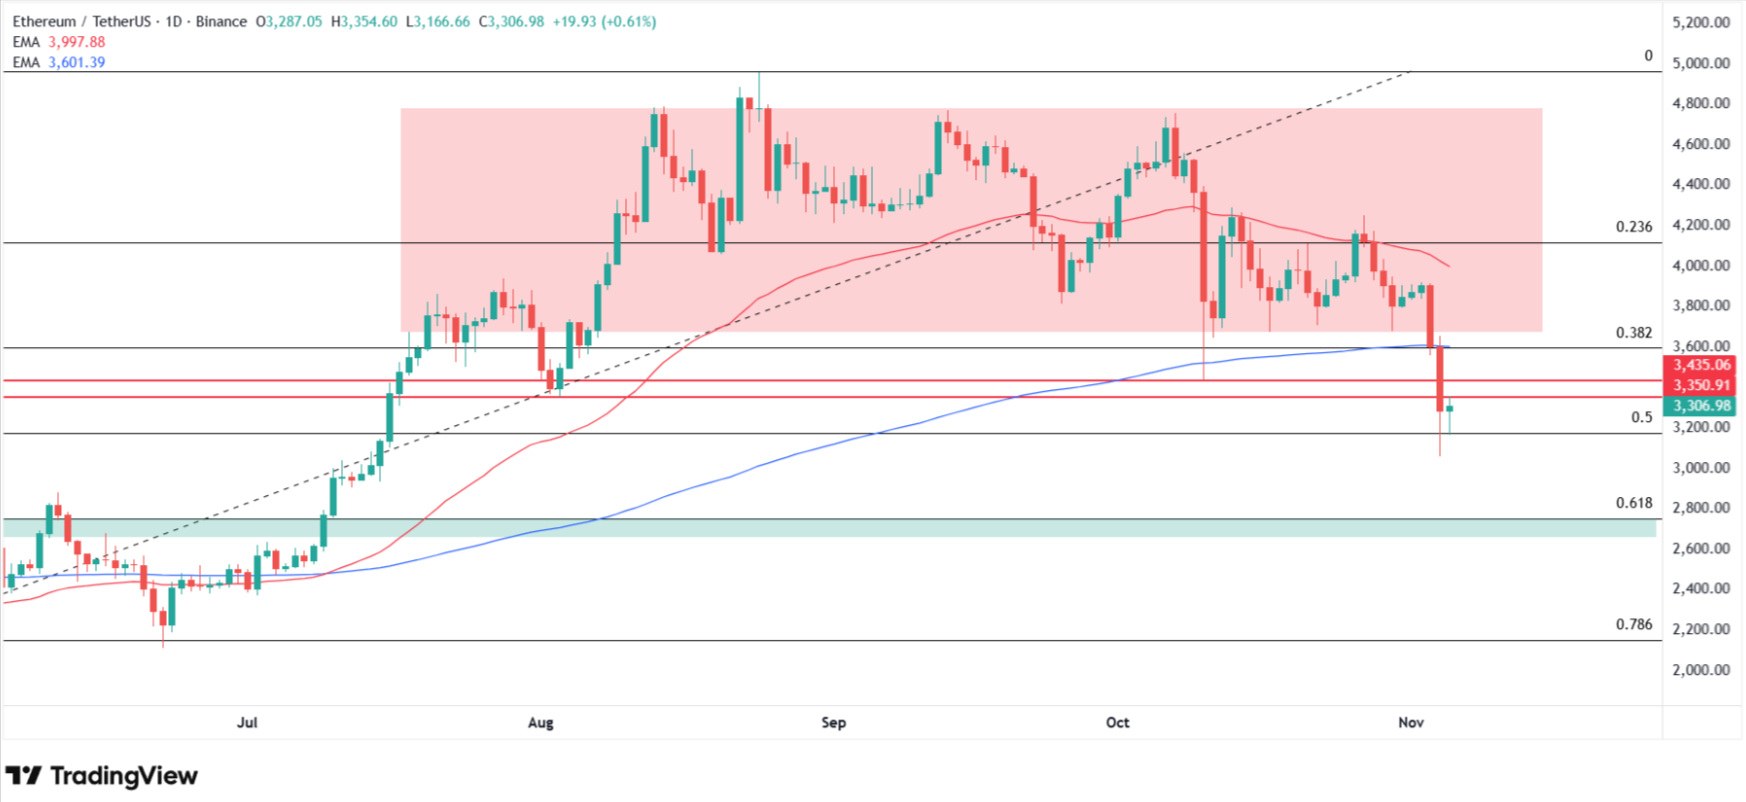
ETH prices
stopped at this moment at the last line of bullish defense, the 50% Fibonacci
retracement drawn from April lows to the highs. This level falls around $3,175.
If it is broken, Ethereum will continue its decline toward the 61.8% Fibonacci
retracement and the range of local May and June highs between $2,760 and $2,650.
At this
moment, bears have the advantage in the market, so further depreciation cannot
be ruled out either, and the target level or range, according to my forecasts,
is the April minimums at the $2,380 level. This means ETH could fall from
current levels by as much as 60%.
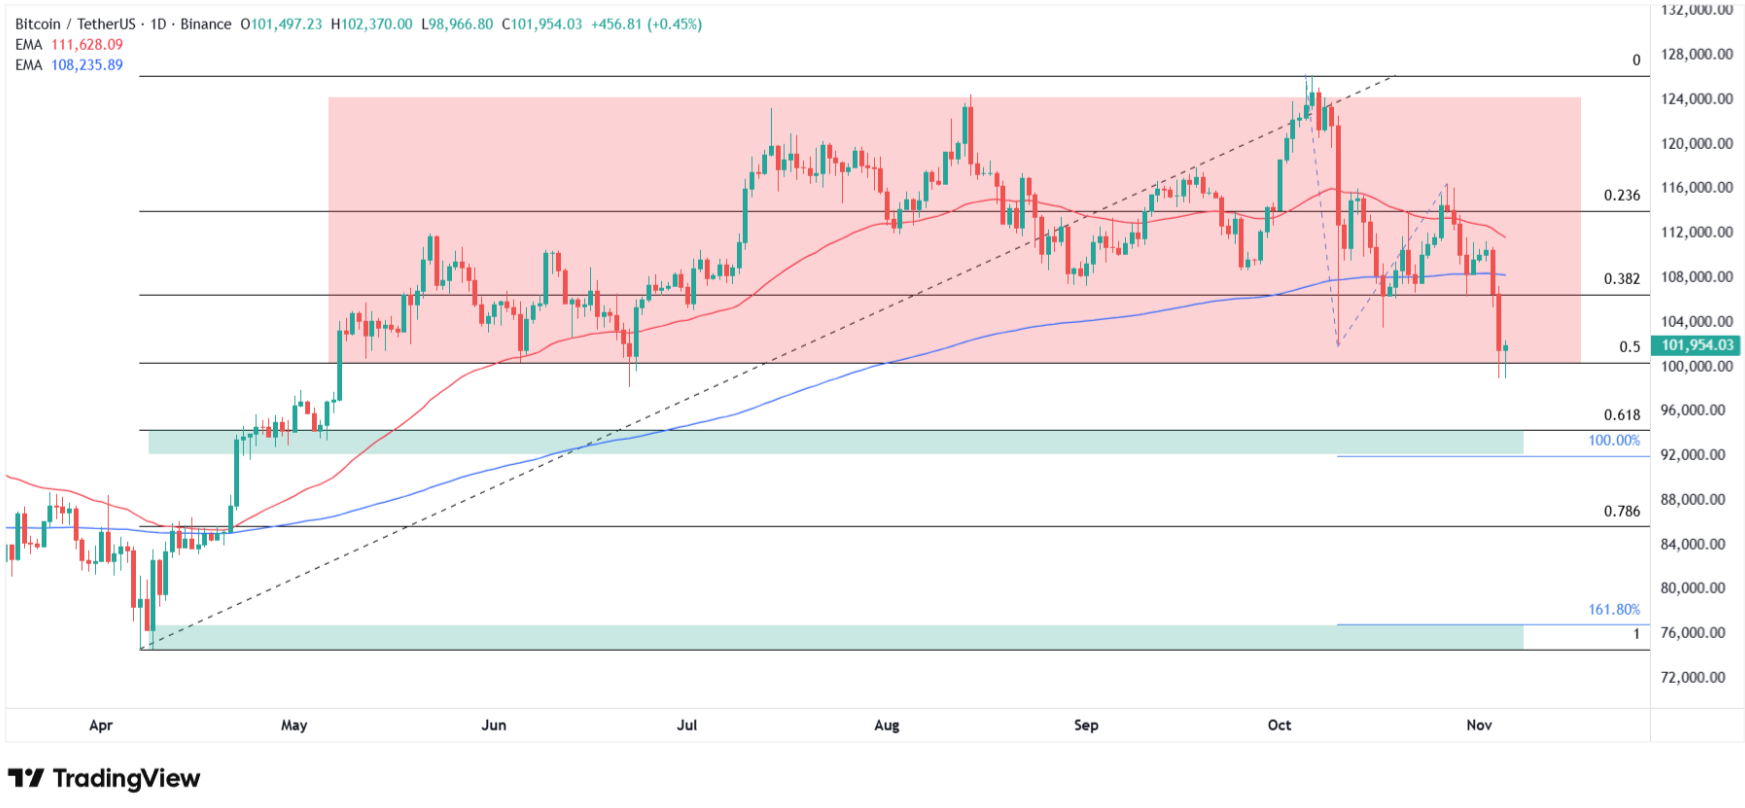
Bitcoin Price Tests $100K
After 8% Two-Day Plunge
The price
of Bitcoin (BTC), like other major cryptocurrencies discussed by me in this
analysis, has two days of dynamic declines behind it, during which it lost a
total of 8% in value, and prices stopped only at the height of the
psychological $100,000 level last tested in June. Today Bitcoin is trying to
violate this level for the second day in a row.
Bulls are
trying to defend for now. If it is broken, however, it opens the road to a much
stronger downward correction. We will officially exit the consolidation range
drawn from May, and moving below the 200-day exponential moving average (200
EMA) only confirms that now bears are in the lead.
I identify
the first zone of declines around the levels of $92,000 and $94,000, where
Fibonacci extension and retracement levels coincide, with the target zone of
declines around $74,000 and $76,000, the April lows where the 161.8% Fibonacci
extension also falls.
You can
read more about the potential range of Bitcoin declines in my separate BTC/USDT
chart analysis which I wrote this week.
Joel
Kruger, strategist at LMAX, also provided important context: “A sustained
move under the 50-week could extend the pullback toward the top of the cloud
near $95,000, where we would expect strong support and the formation of a
higher low before the next leg higher to fresh record highs. The key takeaway:
this remains a healthy correction within an ongoing bull market, not a bearish
shift.”
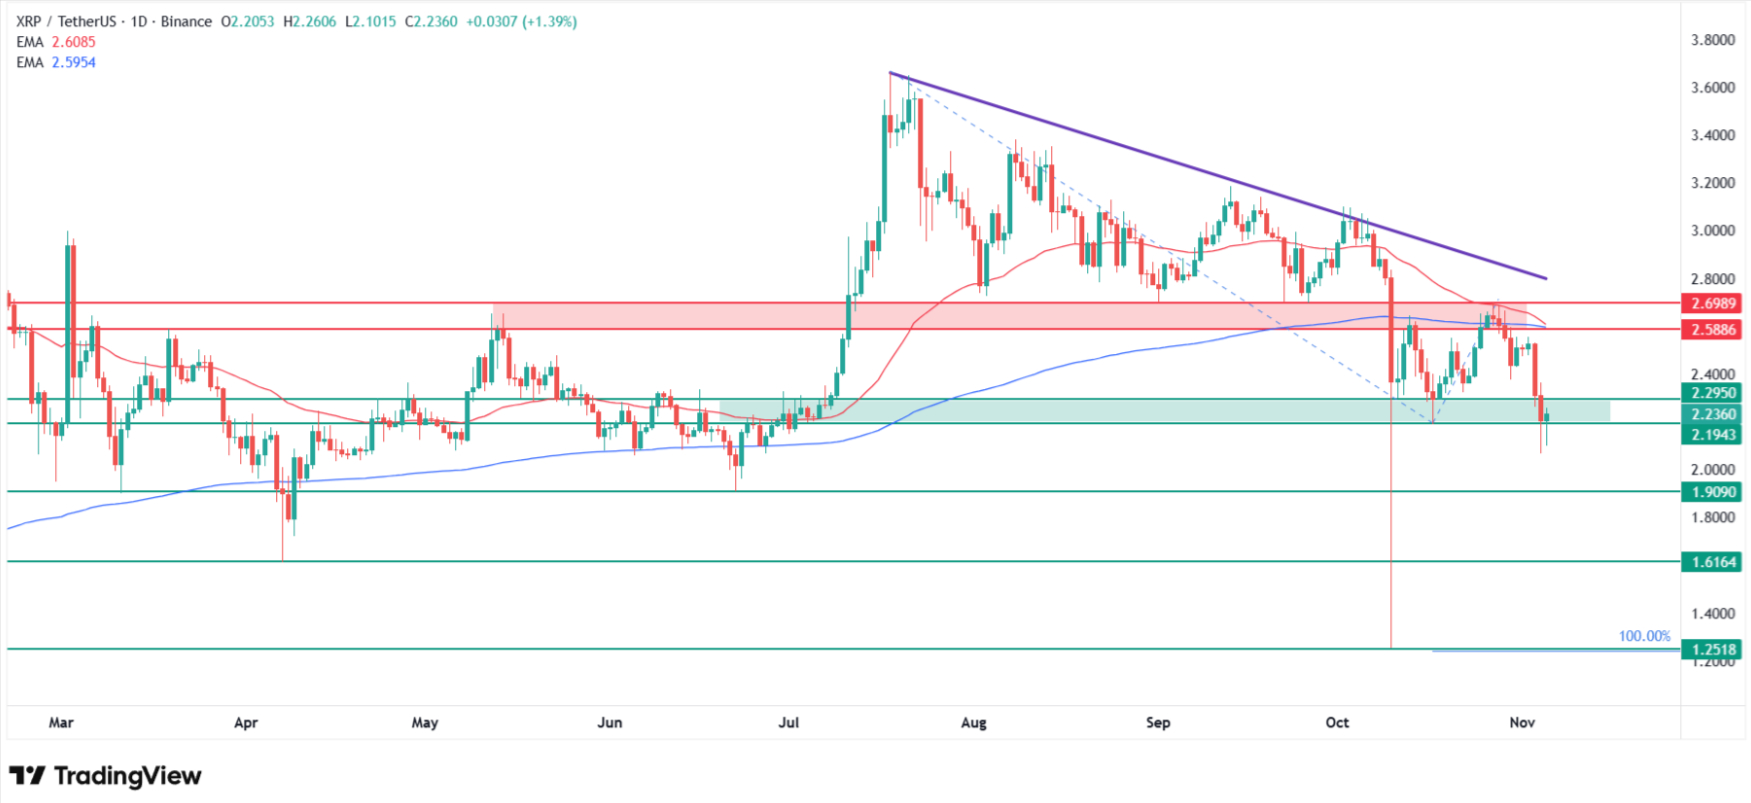
XRP’s Death Cross Looms at
$2.30 Support
The XRP is
managing best for now compared to other leading cryptocurrencies, maintaining
local support levels and trading still in the $2.20-$2.30 zone coinciding with
July lows.
This
doesn’t change the fact, however, that prices broke out at the beginning of
October from a wedge or triangle formation and are currently consolidating at
lower levels below the 50 and 200 EMA which are very close to drawing a death
cross, a crossover which, according to technical analysis enthusiasts like me,
is a strong sell signal.
If the
current support doesn’t hold, we face a decline below the round $2.00 level,
including toward $1.90, June lows. The next target decline level is $1.61 at
April minimums, and the ultimate level is $1.25, the level last observed in
November 2024 coinciding with intraday lows from October 10 when the market
briefly collapsed, as well as my XRP price decline forecast based on Fibonacci
extensions.
You can
read more on this topic in this article I wrote earlier.
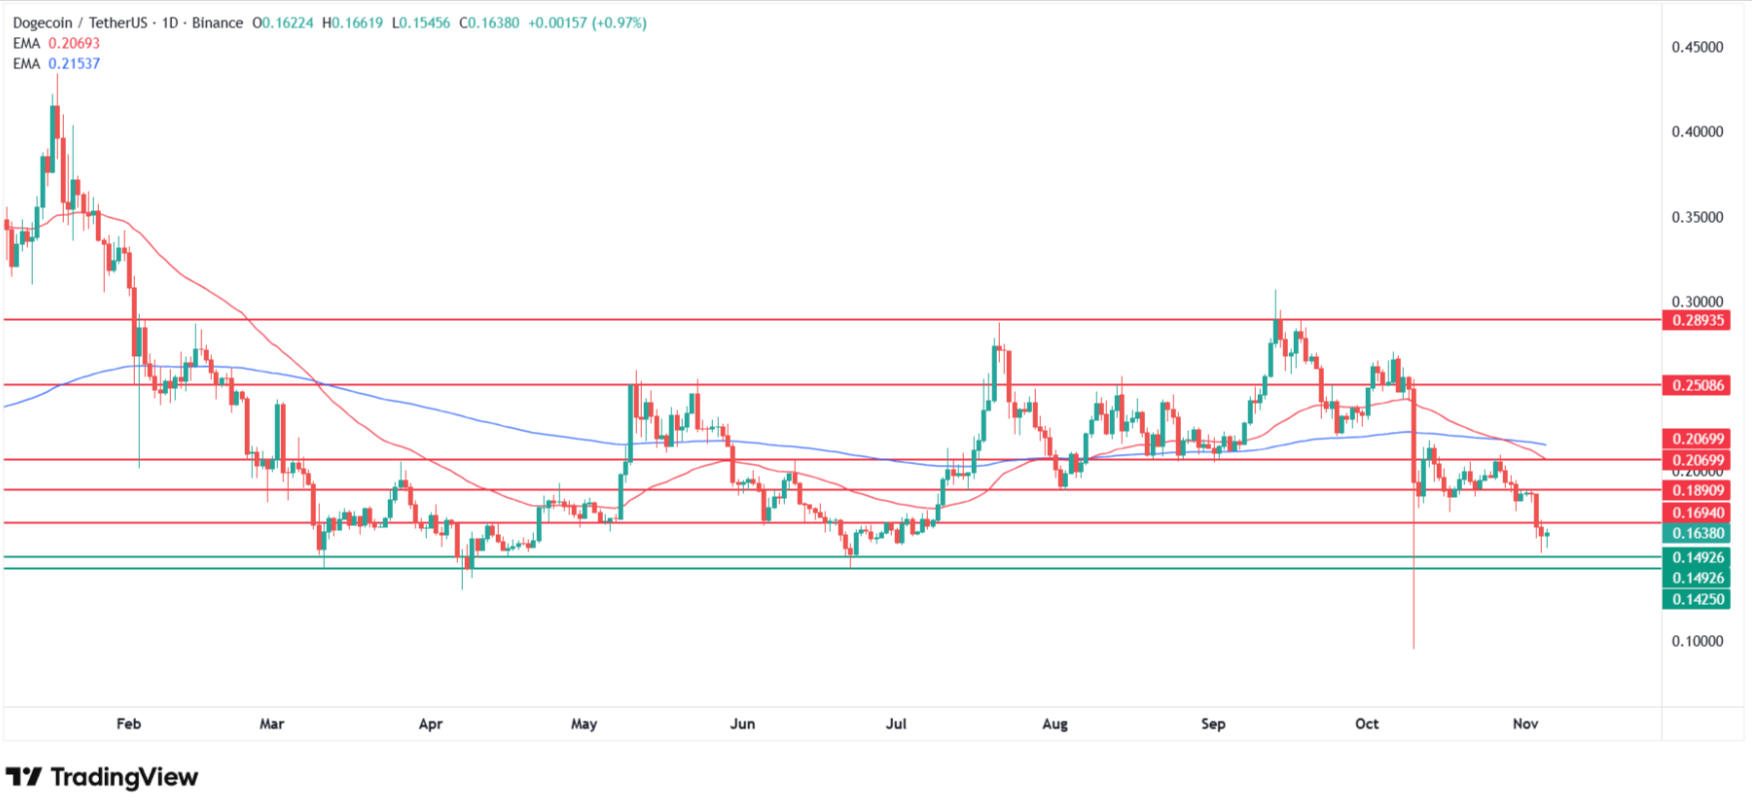
Dogecoin Also Sees Death
Cross, Forms at Channel Bottom
Although
Dogecoin (DOGE) chart clearly shows it has lost and cut itself off from its
September highs by several cents, in broader terms we actually remain in the
same consolidation drawn since February. Its lower limit, which we are
currently witnessing, falls just above the 14-cent level, while the top is at
just under 29 cents.
The last
hours of declines caused some local supports to turn into resistance, and at
this moment, only the lower limit of the sideways channel last tested in June
stands before us. What’s more significant, however, is we’re moving below the
50 and 200 MA which have already formed a death cross formation, the very
strong sell signal mentioned earlier by me.
If the
current support doesn’t hold and we exit this consolidation, Dogecoin could
pave the road to stronger declines and a retest of levels last observed in
August 2024 below the 8-cent level.
Crypto Price Analysis, FAQ
Why is crypto crashing
today?
Cryptocurrency
market lost over $1 trillion since October 6 peak with Bitcoin breaking
$100,000 for first time since June (-5% daily to $100,893), Ethereum crashing
-16% over 48 hours to $3,303, triggered by Federal Reserve Powell walking back
December cuts (probability 96% to 69.3%), AI bubble concerns spreading from
tech selloff (Nasdaq -2%, Nvidia -4%), institutional exodus (Bitcoin ETF
outflows $1.15B) and. leverage cascade ($1.78B liquidations affecting 441,867
traders).
Will Bitcoin go below
$90,000?
Yes, it may.
According to my technical analysis, Bitcoin breaking $100,000 opens path to
first target $92,000-$94,000 (Fibonacci extension/retracement zone coinciding
with April-May lows), ultimate target $74,000-$76,000 (April minimums + 161.8%
Fibonacci extension).
Why are Ethereum and
altcoins falling harder than Bitcoin?
According
to my analysis, Ethereum down -16% over 48 hours breaking below 200-day EMA and
consolidation range from July, bears now in control with potential 60% decline
to $2,380 April lows if 50% Fibonacci support $3,175 breaks, XRP death cross
forming between 50/200 MA at $2.30 support, Dogecoin death cross completed
testing channel bottom 14 cents, altcoins exhibiting 1.5-2x Bitcoin beta
amplification typical during market weakness.
Is this a crypto bear
market?
In my
opnion, yes. Bears warning Peter Schiff “losses staggering surpassing
dot-com bubble,” CredibleCrypto “most severe bear market in Bitcoin’s
history,” $1 trillion market cap loss, institutional exodus $1.15B ETF
outflows, 2018 parallel (October weak, November brutal preceded -37% crash).
Before you go, please also check my previous (and more bullish) crypto price predictions:
The
cryptocurrency market crashed for a second consecutive day today (Wednesday), 5
November 2025, losing over $1 trillion in market capitalization since early
October as Bitcoin, Ethereum, XRP and Dogecoin prices led a broad-based
selloff.
The entire
crypto ecosystem is experiencing dynamic declines with Ethereum at $3,303 (after
-16% two-day crash), Bitcoin testing $100,000 psychological support, and major
altcoins extending losses as institutional investors rotate out of digital
assets.
In this
article, I examine why crypto is going down and conduct a technical analysis of
the BTC/USDT, XRP/USDT, ETH/USDT and DOGE/USDT charts, based on more than 10
years of experience as a cryptocurrency investor and analyst.
Federal
Reserve Chairman Jerome Powell’s hawkish remarks downplaying December rate cuts
created the initial catalyst for crypto’s collapse. The probability of a
December cut collapsed from 96% before Powell’s press conference to just 69.3%
afterward, dampening expectations for looser financial conditions that
typically support cryptocurrency prices.
Paul Howard
from Wincent explained the market dynamics: “Cryptocurrency prices
continued to slide and were pushed lower by a lack of positive macro news.
There appears to be a big skew of selling on a major exchange which would back
up the on-chain analysis indicating this is old BTC whale selling pressure.
Dumping billions gradually into the ecosystem over the course of the last few
days is not panic selling.”
The
cryptocurrency collapse coincides with a broader tech selloff. Palantir dropped
8% despite beating earnings on valuation concerns, while Nvidia shed 4% losing
$200 billion in market capitalization. The Nasdaq fell 2% and the S&P 500
declined 1.2%, reflecting growing worries about AI-driven stock valuations.
Institutional
investors pulled $1.15 billion from Bitcoin ETFs last week, led by BlackRock,
ARK Invest, and Fidelity. This exodus signals a significant shift in sentiment
as traditional financial institutions that drove Bitcoin’s rally to $126,000 in
early October are now reducing exposure amid Federal Reserve uncertainty and AI
bubble concerns.
Ethereum 16% Two-Day Crash
Breaks 200-Day EMA
According
to my technical analysis, the price of Ethereum (ETH) has experienced two days
of dynamic declines in a row, losing approximately 16% within 48 hours. For the
chart situation, this is a very large change, and from my technical analysis,
these declines from the first part of the week fully hand power to the bears,
changing the trend currently to downward.
Most
significantly, we went below the 200-day exponential moving average (200 EMA),
simultaneously breaking out of the consolidation range drawn since July, and
also went below the zone of August lows, leaving behind a series of very
important supports which are now resistance.
ETH prices
stopped at this moment at the last line of bullish defense, the 50% Fibonacci
retracement drawn from April lows to the highs. This level falls around $3,175.
If it is broken, Ethereum will continue its decline toward the 61.8% Fibonacci
retracement and the range of local May and June highs between $2,760 and $2,650.
At this
moment, bears have the advantage in the market, so further depreciation cannot
be ruled out either, and the target level or range, according to my forecasts,
is the April minimums at the $2,380 level. This means ETH could fall from
current levels by as much as 60%.
Bitcoin Price Tests $100K
After 8% Two-Day Plunge
The price
of Bitcoin (BTC), like other major cryptocurrencies discussed by me in this
analysis, has two days of dynamic declines behind it, during which it lost a
total of 8% in value, and prices stopped only at the height of the
psychological $100,000 level last tested in June. Today Bitcoin is trying to
violate this level for the second day in a row.
Bulls are
trying to defend for now. If it is broken, however, it opens the road to a much
stronger downward correction. We will officially exit the consolidation range
drawn from May, and moving below the 200-day exponential moving average (200
EMA) only confirms that now bears are in the lead.
I identify
the first zone of declines around the levels of $92,000 and $94,000, where
Fibonacci extension and retracement levels coincide, with the target zone of
declines around $74,000 and $76,000, the April lows where the 161.8% Fibonacci
extension also falls.
You can
read more about the potential range of Bitcoin declines in my separate BTC/USDT
chart analysis which I wrote this week.
Joel
Kruger, strategist at LMAX, also provided important context: “A sustained
move under the 50-week could extend the pullback toward the top of the cloud
near $95,000, where we would expect strong support and the formation of a
higher low before the next leg higher to fresh record highs. The key takeaway:
this remains a healthy correction within an ongoing bull market, not a bearish
shift.”
XRP’s Death Cross Looms at
$2.30 Support
The XRP is
managing best for now compared to other leading cryptocurrencies, maintaining
local support levels and trading still in the $2.20-$2.30 zone coinciding with
July lows.
This
doesn’t change the fact, however, that prices broke out at the beginning of
October from a wedge or triangle formation and are currently consolidating at
lower levels below the 50 and 200 EMA which are very close to drawing a death
cross, a crossover which, according to technical analysis enthusiasts like me,
is a strong sell signal.
If the
current support doesn’t hold, we face a decline below the round $2.00 level,
including toward $1.90, June lows. The next target decline level is $1.61 at
April minimums, and the ultimate level is $1.25, the level last observed in
November 2024 coinciding with intraday lows from October 10 when the market
briefly collapsed, as well as my XRP price decline forecast based on Fibonacci
extensions.
You can
read more on this topic in this article I wrote earlier.
Dogecoin Also Sees Death
Cross, Forms at Channel Bottom
Although
Dogecoin (DOGE) chart clearly shows it has lost and cut itself off from its
September highs by several cents, in broader terms we actually remain in the
same consolidation drawn since February. Its lower limit, which we are
currently witnessing, falls just above the 14-cent level, while the top is at
just under 29 cents.
The last
hours of declines caused some local supports to turn into resistance, and at
this moment, only the lower limit of the sideways channel last tested in June
stands before us. What’s more significant, however, is we’re moving below the
50 and 200 MA which have already formed a death cross formation, the very
strong sell signal mentioned earlier by me.
If the
current support doesn’t hold and we exit this consolidation, Dogecoin could
pave the road to stronger declines and a retest of levels last observed in
August 2024 below the 8-cent level.
Crypto Price Analysis, FAQ
Why is crypto crashing
today?
Cryptocurrency
market lost over $1 trillion since October 6 peak with Bitcoin breaking
$100,000 for first time since June (-5% daily to $100,893), Ethereum crashing
-16% over 48 hours to $3,303, triggered by Federal Reserve Powell walking back
December cuts (probability 96% to 69.3%), AI bubble concerns spreading from
tech selloff (Nasdaq -2%, Nvidia -4%), institutional exodus (Bitcoin ETF
outflows $1.15B) and. leverage cascade ($1.78B liquidations affecting 441,867
traders).
Will Bitcoin go below
$90,000?
Yes, it may.
According to my technical analysis, Bitcoin breaking $100,000 opens path to
first target $92,000-$94,000 (Fibonacci extension/retracement zone coinciding
with April-May lows), ultimate target $74,000-$76,000 (April minimums + 161.8%
Fibonacci extension).
Why are Ethereum and
altcoins falling harder than Bitcoin?
According
to my analysis, Ethereum down -16% over 48 hours breaking below 200-day EMA and
consolidation range from July, bears now in control with potential 60% decline
to $2,380 April lows if 50% Fibonacci support $3,175 breaks, XRP death cross
forming between 50/200 MA at $2.30 support, Dogecoin death cross completed
testing channel bottom 14 cents, altcoins exhibiting 1.5-2x Bitcoin beta
amplification typical during market weakness.
Is this a crypto bear
market?
In my
opnion, yes. Bears warning Peter Schiff “losses staggering surpassing
dot-com bubble,” CredibleCrypto “most severe bear market in Bitcoin’s
history,” $1 trillion market cap loss, institutional exodus $1.15B ETF
outflows, 2018 parallel (October weak, November brutal preceded -37% crash).
Before you go, please also check my previous (and more bullish) crypto price predictions:
Search
RECENT PRESS RELEASES
Can Plug Power Stock Be a 10X Investment?
SWI Editorial Staff2025-11-05T12:55:19-08:00November 5, 2025|
Realty Income Reported Earnings Monday. Here’s What Investors Need to Know.
SWI Editorial Staff2025-11-05T12:54:49-08:00November 5, 2025|
Microsoft Just Gave Investors 9.7 Billion Reasons to Buy This Monster Artificial Intellige
SWI Editorial Staff2025-11-05T12:54:21-08:00November 5, 2025|
‘Investing’ in CTOs With Staged PCI Seems to Pay Off in Safety Gains
SWI Editorial Staff2025-11-05T12:53:47-08:00November 5, 2025|
We must combat ‘blending’ of sports betting and investing, warns Schwab CEO
SWI Editorial Staff2025-11-05T12:53:25-08:00November 5, 2025|
How actively managed ETFs can help investors weather volatility
SWI Editorial Staff2025-11-05T12:52:56-08:00November 5, 2025|
Related Post

