Why Crypto Is Going Down Today? Bitcoin, XRP Price, Ethereum and Dogecoin Moves Under Deat
December 17, 2025
Cryptocurrency
markets are trading under pressure Wednesday as Bitcoin holds near $87,700,
down a marginal 0.2%, while Ethereum, XRP and Dogecoin face modest losses amid
regulatory uncertainty and consolidation fatigue. The entire crypto market is
stuck in a holding pattern ahead of the holiday period, with 75% of the top 100
coins now trading below key moving averages.
In this article, I answer
the question of why cryptocurrencies are falling and analyze the BTC/USDT,
ETH/USDT, XRP/USDT, and DOGE/USDT charts, drawing on more than ten years of
experience as a trader and analyst.
Global
risk-off sentiment and fading liquidity are dragging crypto lower as investors
await clarity on central bank policy and regulatory frameworks. The selloff
coincided with news that the US Senate Banking Committee has delayed work on
the long-awaited crypto market structure bill, pushing all hearings to early
2026.
“The decline also coincided
with news that the U.S. Senate Banking Committee had delayed work on the
long-awaited bill addressing the structure of the cryptocurrency market,
postponing any hearings until early 2026,” explains Michał Stajniak, an analyst
at XTB. Although XTB is primarily known as a CFD broker, it
is currently working on introducing spot cryptocurrency trading.
The
committee failed to finalize a bipartisan agreement before the end of the year.
The office of Chairman Tim Scott emphasized that negotiations with Democrats
are still ongoing, but issues related to financial stability, market integrity,
and ethical standards continue to slow progress.
Adding
complexity, 2026 begins with a tight legislative calendar focused on government
funding, followed by November midterm elections that could push crypto
legislation even further back.
Why Bitcoin Price Is Going
Down? BTC/USDT Technical Analysis
Bitcoin (BTC)
on Wednesday costs $87,700 and is losing a negligible 0.2%, continuing to hold
within the same consolidation range it entered in mid-November. According to my
technical analysis, the resistance sits in the $92,000–94,000 range, reinforced
by 100% Fibonacci retracement and the 50-day exponential moving average, while
the lower boundary extends from $85,600 to $84,000, providing a temporary rest
stop for bulls.
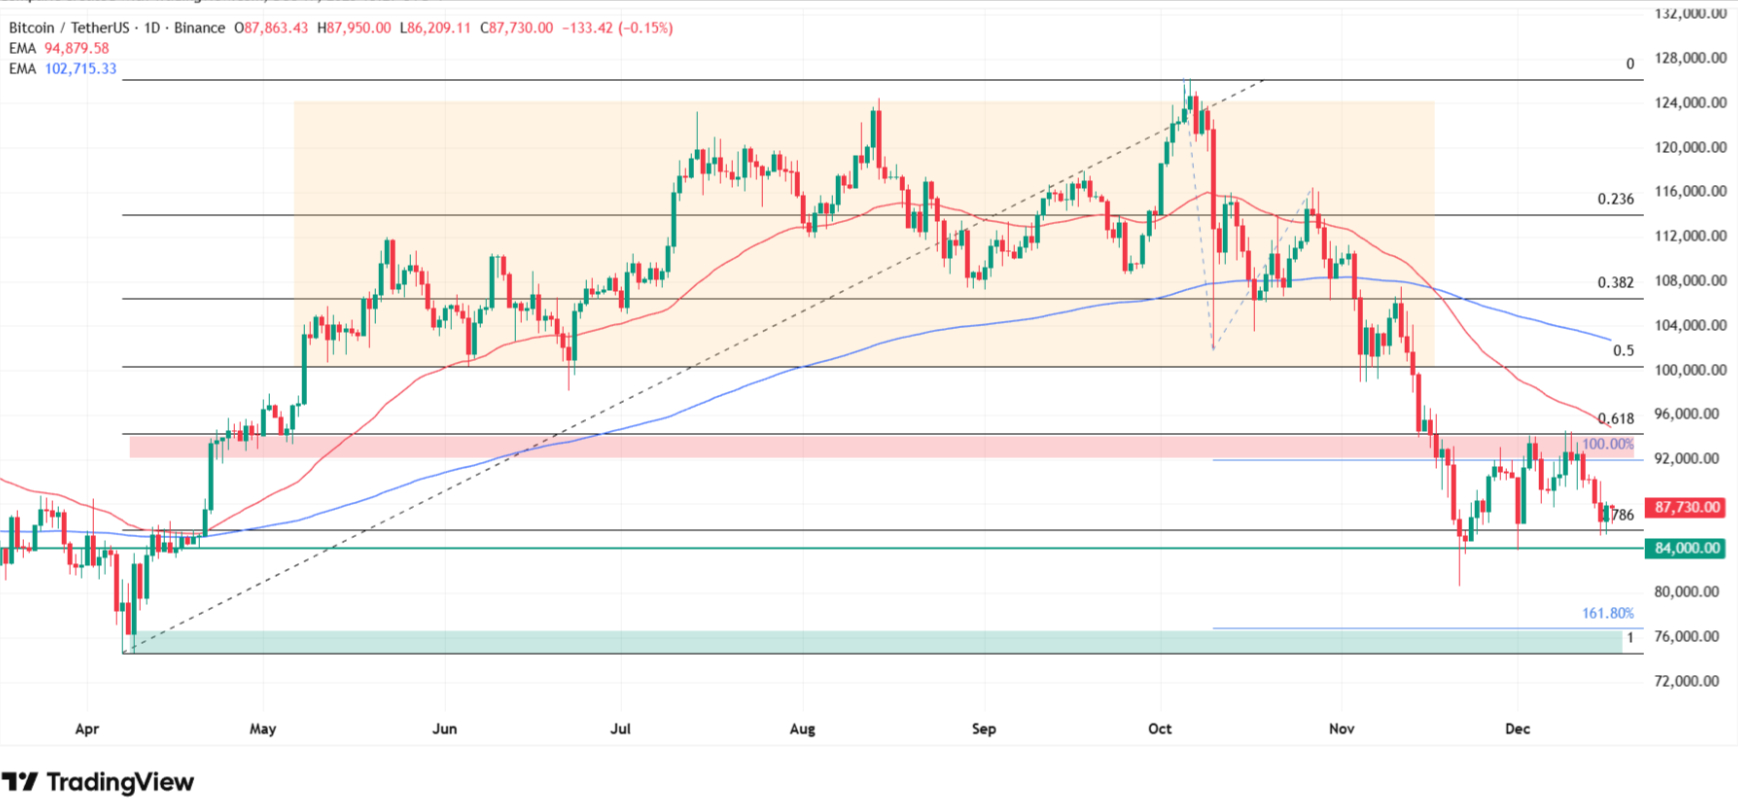
Why
temporary? Because as I have written in many earlier analyses, I am currently
targeting a move down to this year’s lows around the $74,000 level. There are
many reasons for this, including a death cross drawn on the daily Bitcoin chart
a month ago.
What can we
expect in the coming days before the holidays? I don’t anticipate anything
spectacular, rather a continuation of this sideways trend followed by further
downside, and only a reset and washout near this year’s lows will allow for a
stronger rally and re-accumulation at lower prices, with a medium-term return
to all-time highs and higher.
Ethereum Price Still Under
Death Cross Signal
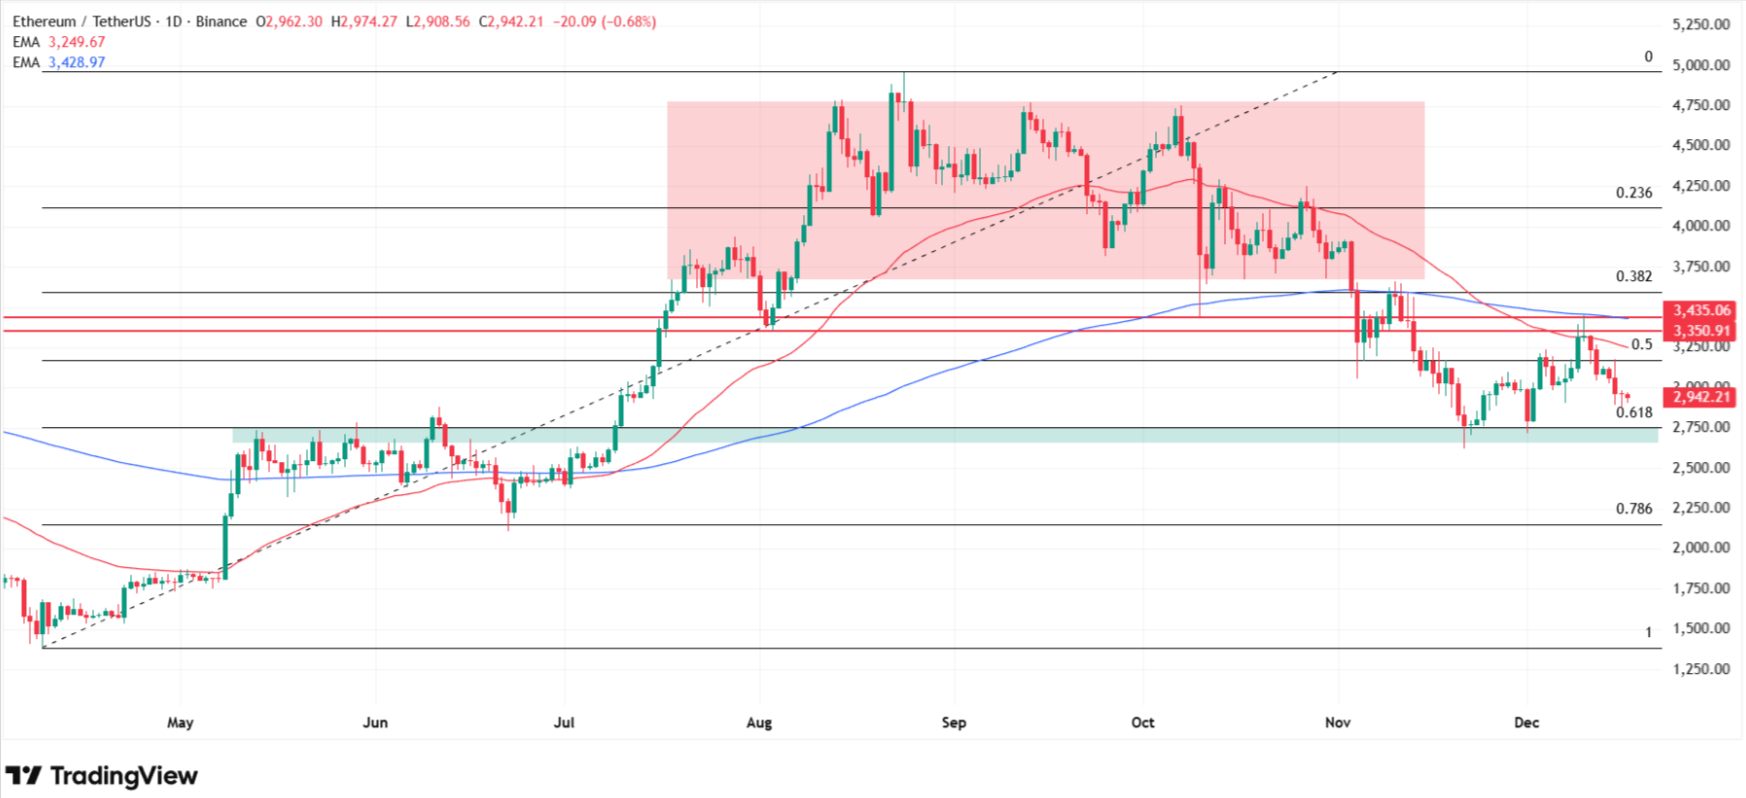
The chart
of the second-largest cryptocurrency by market cap, Ethereum (ETH), looks very
similar to Bitcoin’s chart. We also see a local range here and a lack of
conviction from buyers and sellers about which direction to move.
At the
moment, ETH is losing for a fourth consecutive session, though the declines are
modest at 0.5% today, and the cryptocurrency is changing hands at $2,950.
The main
resistance zone is located between $3,350 and $3,435, supported by a grid of
moving averages, while support is the 61.8% Fibonacci retracement and
November-December lows around the $2,700 level. Here too I maintain a bearish
stance due to the ongoing downtrend, and I do not rule out a move toward
$2,200, the June low, and ultimately even $1,400, the April minimum.
XRP Price Is Also Dropping
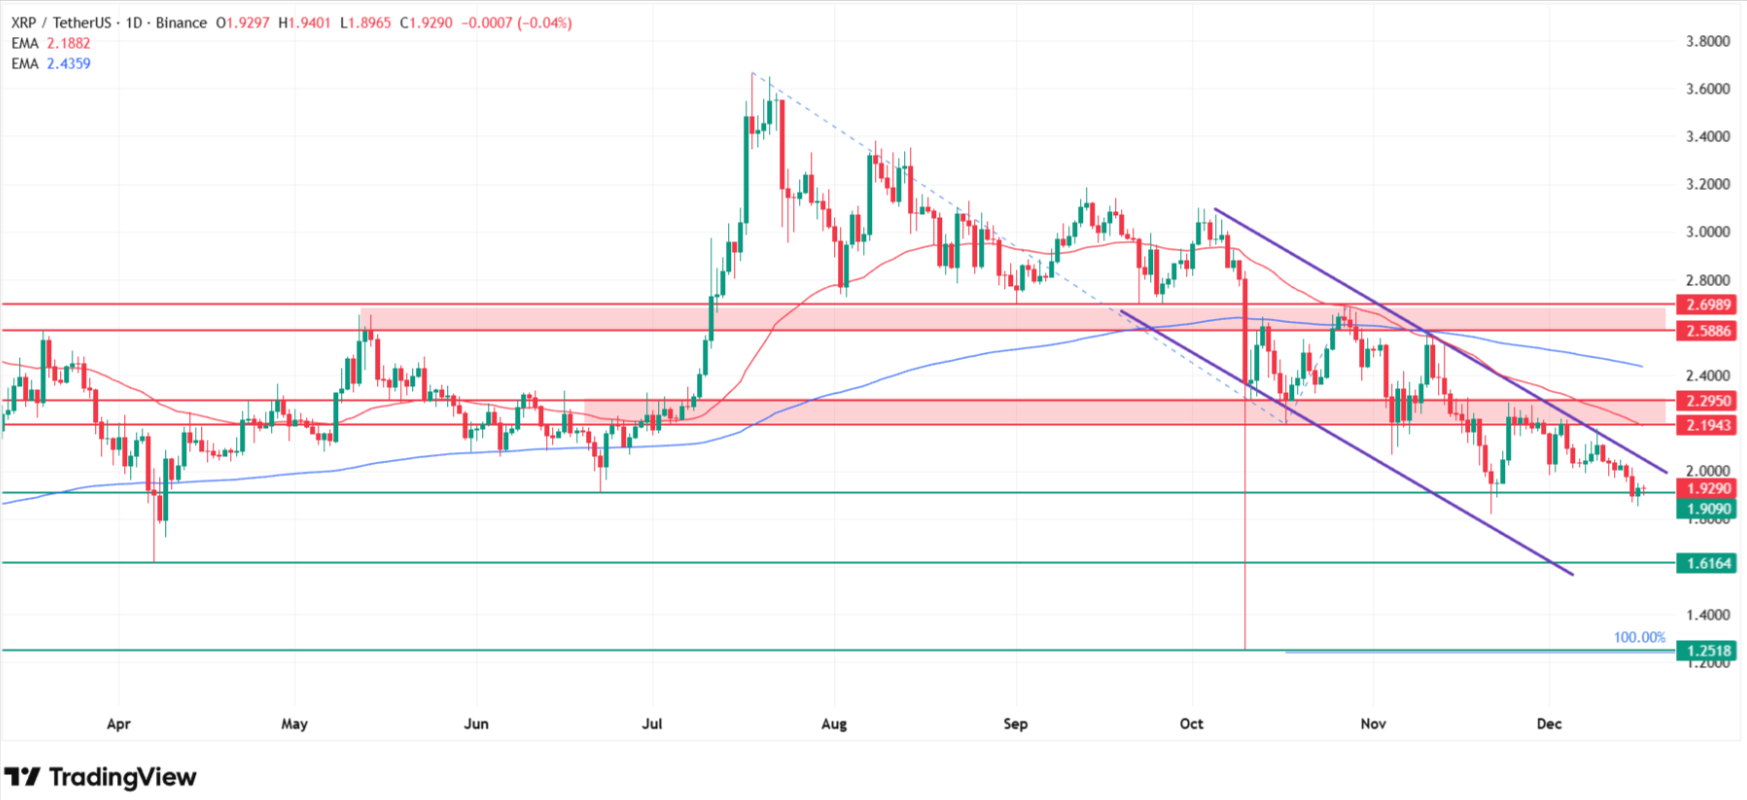
For one XRP
you currently pay $1.92, and the quotes are standing for another session at the
height of a local support level marked by November lows, last tested also in
June. Once again, as on the two previous charts, we see roughly a month-long
consolidation whose upper boundary is the current range between $2.20 and
$2.30, additionally supported by the 50-day moving average.
The
arrangement of moving averages is practically the same, with a death cross
drawn in November and a dominant downtrend. A breakout of the local support
would open the way to the April lows near $1.61, and further to $1.25 where
price was last located during the October flash crash and earlier over a year
ago in late November 2024.
Why Is Dogecoin So
Volatile?
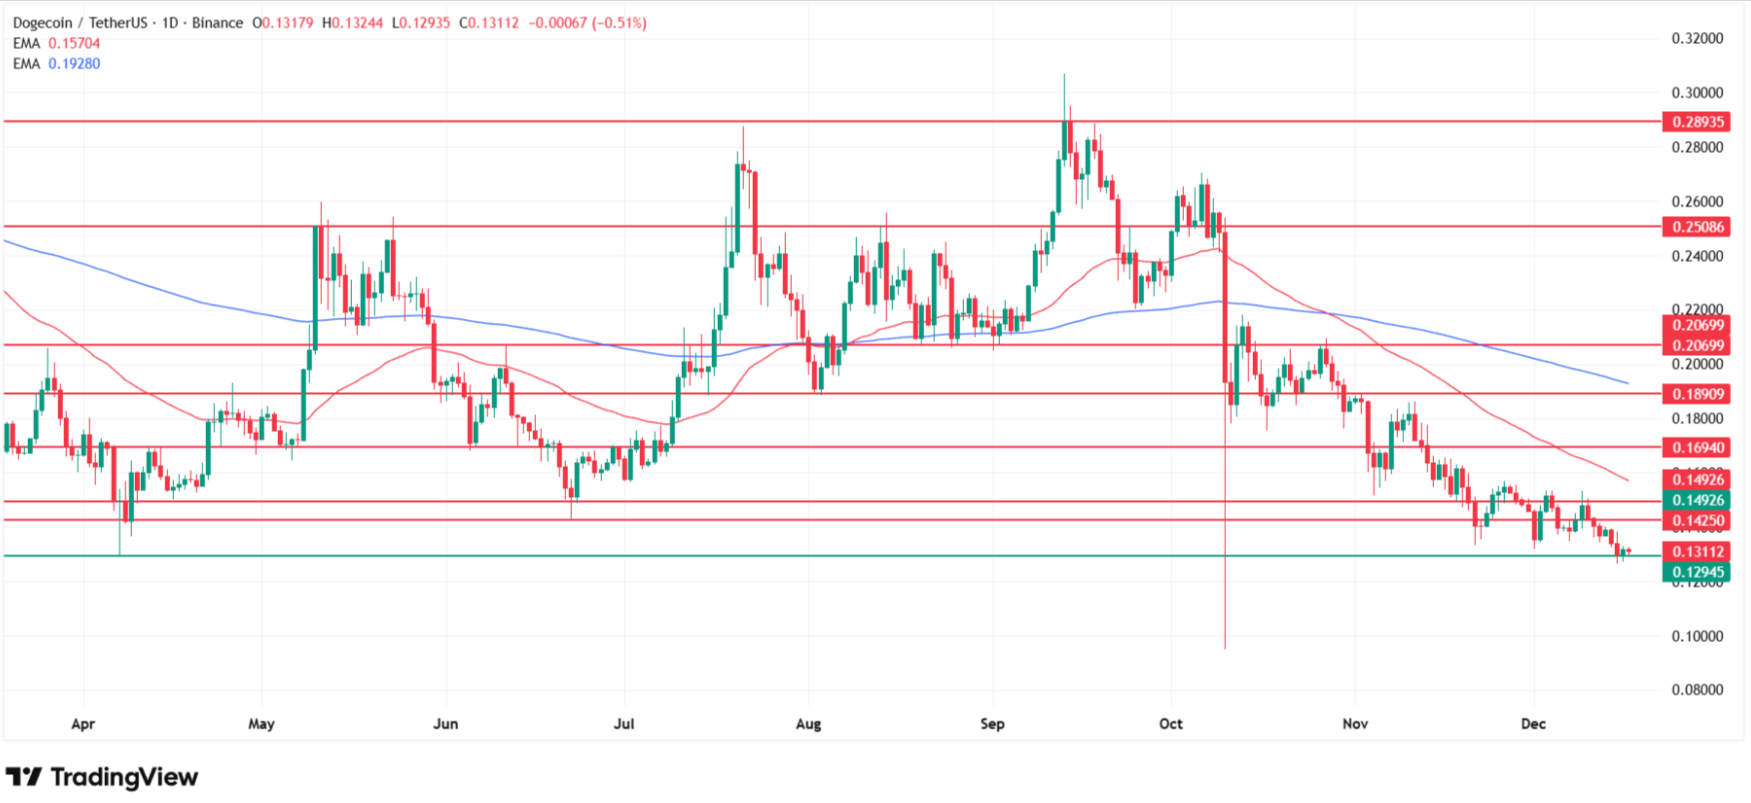
For dessert
I saved the precursor of the meme coin market, namely Dogecoin (DOGE), which has
already permanently broken the support zone I set earlier in the year around
0.14 and 0.15 dollars, as well as its deepening from the beginning of this
month.
As a
result, the price is still being held in check by the April 7, 2025 lows. If
this level is also broken, we will be heading below 0.10 dollars, targeting the
October flash crash minimums around 0.09 dollars, levels last observed in
September 2024.
Dogecoin
trades near $0.13 Wednesday, illustrating high-beta, sentiment-driven behavior
where thin liquidity and fading risk appetite drive exaggerated percentage
moves.
How Low Can Crypto Go?
“Most
are surprised by the lack of follow-through despite so many positive
catalysts,” said Pratik Kala, a portfolio manager at hedge fund Apollo
Crypto. This sentiment reflects broader market frustration with the inability
of Bitcoin and altcoins to break higher despite constructive regulatory
developments and ETF approvals.
If current
support breaks, the next major zone for Bitcoin lies near the $74,000 area I
have outlined. For Ethereum, a deeper correction toward $2,200 or even $1,400
cannot be ruled out if macro conditions worsen. For XRP and Dogecoin, downside
can be amplified due to thinner liquidity and higher volatility, with targets
at $1.61 and $0.09 respectively.
Crypto Price Analysis, FAQ
Why is Bitcoin falling?
Bitcoin is
falling because it remains trapped in a month-long consolidation range with
resistance at $92,000-$94,000 and weakening momentum signaled by a death cross
formation on the daily chart. According to my technical analysis, BTC is
targeting a move down to this year’s lows around $74,000 as the sideways
pattern resolves to the downside.
Why is Ethereum crashing?
Ethereum is
not crashing but declining modestly for a fourth consecutive session, down 0.5%
to $2,950, as it mirrors Bitcoin’s sideways consolidation pattern. The bearish
technical setup includes resistance at $3,350-$3,435 and support at $2,700,
with my analysis targeting potential moves toward $2,200 or even $1,400 if the
downtrend continues.
Why is XRP price dropping?
XRP is
dropping because it’s testing local support at November lows near $1.90 after
failing to break resistance at $2.20-$2.30, while regulatory delays add
uncertainty. My technical analysis shows a death cross formation and dominant
downtrend that could push XRP toward $1.61 and ultimately $1.25 if current
support breaks.
Why is Dogecoin going
down?
Dogecoin is
going down because it has already broken key support zones at $0.14-$0.15 and
is now testing April lows as a high-beta meme coin amplifies broader market
weakness. Trading near $0.13, DOGE faces potential further decline toward $0.09
if sentiment remains negative and liquidity continues to thin.
Will crypto recover?
Crypto can
recover if equity markets stabilize, central banks provide clearer easing
guidance, and forced liquidations subside, allowing spot buyers and long-term
holders to return. According to my analysis, a washout near this year’s lows
would create healthier conditions for re-accumulation and a medium-term return
to all-time highs.
Cryptocurrency
markets are trading under pressure Wednesday as Bitcoin holds near $87,700,
down a marginal 0.2%, while Ethereum, XRP and Dogecoin face modest losses amid
regulatory uncertainty and consolidation fatigue. The entire crypto market is
stuck in a holding pattern ahead of the holiday period, with 75% of the top 100
coins now trading below key moving averages.
In this article, I answer
the question of why cryptocurrencies are falling and analyze the BTC/USDT,
ETH/USDT, XRP/USDT, and DOGE/USDT charts, drawing on more than ten years of
experience as a trader and analyst.
Global
risk-off sentiment and fading liquidity are dragging crypto lower as investors
await clarity on central bank policy and regulatory frameworks. The selloff
coincided with news that the US Senate Banking Committee has delayed work on
the long-awaited crypto market structure bill, pushing all hearings to early
2026.
“The decline also coincided
with news that the U.S. Senate Banking Committee had delayed work on the
long-awaited bill addressing the structure of the cryptocurrency market,
postponing any hearings until early 2026,” explains Michał Stajniak, an analyst
at XTB. Although XTB is primarily known as a CFD broker, it
is currently working on introducing spot cryptocurrency trading.
The
committee failed to finalize a bipartisan agreement before the end of the year.
The office of Chairman Tim Scott emphasized that negotiations with Democrats
are still ongoing, but issues related to financial stability, market integrity,
and ethical standards continue to slow progress.
Adding
complexity, 2026 begins with a tight legislative calendar focused on government
funding, followed by November midterm elections that could push crypto
legislation even further back.
Why Bitcoin Price Is Going
Down? BTC/USDT Technical Analysis
Bitcoin (BTC)
on Wednesday costs $87,700 and is losing a negligible 0.2%, continuing to hold
within the same consolidation range it entered in mid-November. According to my
technical analysis, the resistance sits in the $92,000–94,000 range, reinforced
by 100% Fibonacci retracement and the 50-day exponential moving average, while
the lower boundary extends from $85,600 to $84,000, providing a temporary rest
stop for bulls.
Why
temporary? Because as I have written in many earlier analyses, I am currently
targeting a move down to this year’s lows around the $74,000 level. There are
many reasons for this, including a death cross drawn on the daily Bitcoin chart
a month ago.
What can we
expect in the coming days before the holidays? I don’t anticipate anything
spectacular, rather a continuation of this sideways trend followed by further
downside, and only a reset and washout near this year’s lows will allow for a
stronger rally and re-accumulation at lower prices, with a medium-term return
to all-time highs and higher.
Ethereum Price Still Under
Death Cross Signal
The chart
of the second-largest cryptocurrency by market cap, Ethereum (ETH), looks very
similar to Bitcoin’s chart. We also see a local range here and a lack of
conviction from buyers and sellers about which direction to move.
At the
moment, ETH is losing for a fourth consecutive session, though the declines are
modest at 0.5% today, and the cryptocurrency is changing hands at $2,950.
The main
resistance zone is located between $3,350 and $3,435, supported by a grid of
moving averages, while support is the 61.8% Fibonacci retracement and
November-December lows around the $2,700 level. Here too I maintain a bearish
stance due to the ongoing downtrend, and I do not rule out a move toward
$2,200, the June low, and ultimately even $1,400, the April minimum.
XRP Price Is Also Dropping
For one XRP
you currently pay $1.92, and the quotes are standing for another session at the
height of a local support level marked by November lows, last tested also in
June. Once again, as on the two previous charts, we see roughly a month-long
consolidation whose upper boundary is the current range between $2.20 and
$2.30, additionally supported by the 50-day moving average.
The
arrangement of moving averages is practically the same, with a death cross
drawn in November and a dominant downtrend. A breakout of the local support
would open the way to the April lows near $1.61, and further to $1.25 where
price was last located during the October flash crash and earlier over a year
ago in late November 2024.
Why Is Dogecoin So
Volatile?
For dessert
I saved the precursor of the meme coin market, namely Dogecoin (DOGE), which has
already permanently broken the support zone I set earlier in the year around
0.14 and 0.15 dollars, as well as its deepening from the beginning of this
month.
As a
result, the price is still being held in check by the April 7, 2025 lows. If
this level is also broken, we will be heading below 0.10 dollars, targeting the
October flash crash minimums around 0.09 dollars, levels last observed in
September 2024.
Dogecoin
trades near $0.13 Wednesday, illustrating high-beta, sentiment-driven behavior
where thin liquidity and fading risk appetite drive exaggerated percentage
moves.
How Low Can Crypto Go?
“Most
are surprised by the lack of follow-through despite so many positive
catalysts,” said Pratik Kala, a portfolio manager at hedge fund Apollo
Crypto. This sentiment reflects broader market frustration with the inability
of Bitcoin and altcoins to break higher despite constructive regulatory
developments and ETF approvals.
If current
support breaks, the next major zone for Bitcoin lies near the $74,000 area I
have outlined. For Ethereum, a deeper correction toward $2,200 or even $1,400
cannot be ruled out if macro conditions worsen. For XRP and Dogecoin, downside
can be amplified due to thinner liquidity and higher volatility, with targets
at $1.61 and $0.09 respectively.
Crypto Price Analysis, FAQ
Why is Bitcoin falling?
Bitcoin is
falling because it remains trapped in a month-long consolidation range with
resistance at $92,000-$94,000 and weakening momentum signaled by a death cross
formation on the daily chart. According to my technical analysis, BTC is
targeting a move down to this year’s lows around $74,000 as the sideways
pattern resolves to the downside.
Why is Ethereum crashing?
Ethereum is
not crashing but declining modestly for a fourth consecutive session, down 0.5%
to $2,950, as it mirrors Bitcoin’s sideways consolidation pattern. The bearish
technical setup includes resistance at $3,350-$3,435 and support at $2,700,
with my analysis targeting potential moves toward $2,200 or even $1,400 if the
downtrend continues.
Why is XRP price dropping?
XRP is
dropping because it’s testing local support at November lows near $1.90 after
failing to break resistance at $2.20-$2.30, while regulatory delays add
uncertainty. My technical analysis shows a death cross formation and dominant
downtrend that could push XRP toward $1.61 and ultimately $1.25 if current
support breaks.
Why is Dogecoin going
down?
Dogecoin is
going down because it has already broken key support zones at $0.14-$0.15 and
is now testing April lows as a high-beta meme coin amplifies broader market
weakness. Trading near $0.13, DOGE faces potential further decline toward $0.09
if sentiment remains negative and liquidity continues to thin.
Will crypto recover?
Crypto can
recover if equity markets stabilize, central banks provide clearer easing
guidance, and forced liquidations subside, allowing spot buyers and long-term
holders to return. According to my analysis, a washout near this year’s lows
would create healthier conditions for re-accumulation and a medium-term return
to all-time highs.
Search
RECENT PRESS RELEASES
UK approves the Morecambe Offshore Wind Farm, clearing the 480 MW project to begin constru
SWI Editorial Staff2025-12-17T08:19:56-08:00December 17, 2025|
Amazon’s ride-hailing exec wants to ‘move people around’ in robotaxis: ‘If you’re with fri
SWI Editorial Staff2025-12-17T08:19:23-08:00December 17, 2025|
Bitcoin Will Plummet to $10,000, Bloomberg Analyst Predicts
SWI Editorial Staff2025-12-17T08:18:40-08:00December 17, 2025|
Scams involving Bitcoin ATMs on the rise in Mississippi
SWI Editorial Staff2025-12-17T08:18:17-08:00December 17, 2025|
Why Crypto Is Going Down Today? Bitcoin, XRP Price, Ethereum and Dogecoin Moves Under Deat
SWI Editorial Staff2025-12-17T08:17:57-08:00December 17, 2025|
Bhutan Promises Up To 10,000 Bitcoin For New Mega-City
SWI Editorial Staff2025-12-17T08:17:37-08:00December 17, 2025|
Related Post


