Why Crypto Is Going Down? XRP, Bitcoin, Ethereum and Dogecoin Prices Lead Selloff Today
September 22, 2025
Digital
asset prices tumbled across the board today (Monday), with Bitcoin (BTC) and
Ethereum (ETH) leading a broad-based selloff that sent major cryptocurrencies
toward multi-week lows as technical levels crumbled and profit-taking
accelerated.
The
cryptocurrency market’s total capitalization fell by $77 billion during
Monday’s session, with more than 400,000 traders facing liquidations worth $1.7
billion combined. Market sentiment has turned decidedly cautious as traders
reassess positioning ahead of month-end.
Why are
cryptocurrencies falling? In this article, I address that question by analyzing
technical charts for XRP/USDT, BTC/USDT, DOGE/USDT, and ETH/USDT.
Several
macro factors have contributed to the selloff. While last week’s Federal
Reserve rate cut to 4.00-4.25% initially supported risk assets, Chair Powell’s
cautious stance on inflation has tempered expectations for rapid easing.
“As a result, traders have been reluctant to extend crypto’s recent rally
without fresh macro catalysts,” explained Joel Kruger, FX and crypto
strategist at LMAX Group.
“The
market tone has turned cautious, perhaps on the back of renewed outperformance
in the price of Bitcoin relative to ETH, signaling a flight to quality,” he
added. “Some profit taking is also likely at play after an impressive
September rally, unusual for a month that has historically been one of
bitcoin’s weakest.”
The
strategist pointed to upcoming economic data as key market drivers:
“Investors are watching upcoming PCE inflation data and a heavy slate of
Fed commentary this week, both of which could reprice rate-cut expectations and
influence liquidity conditions.”
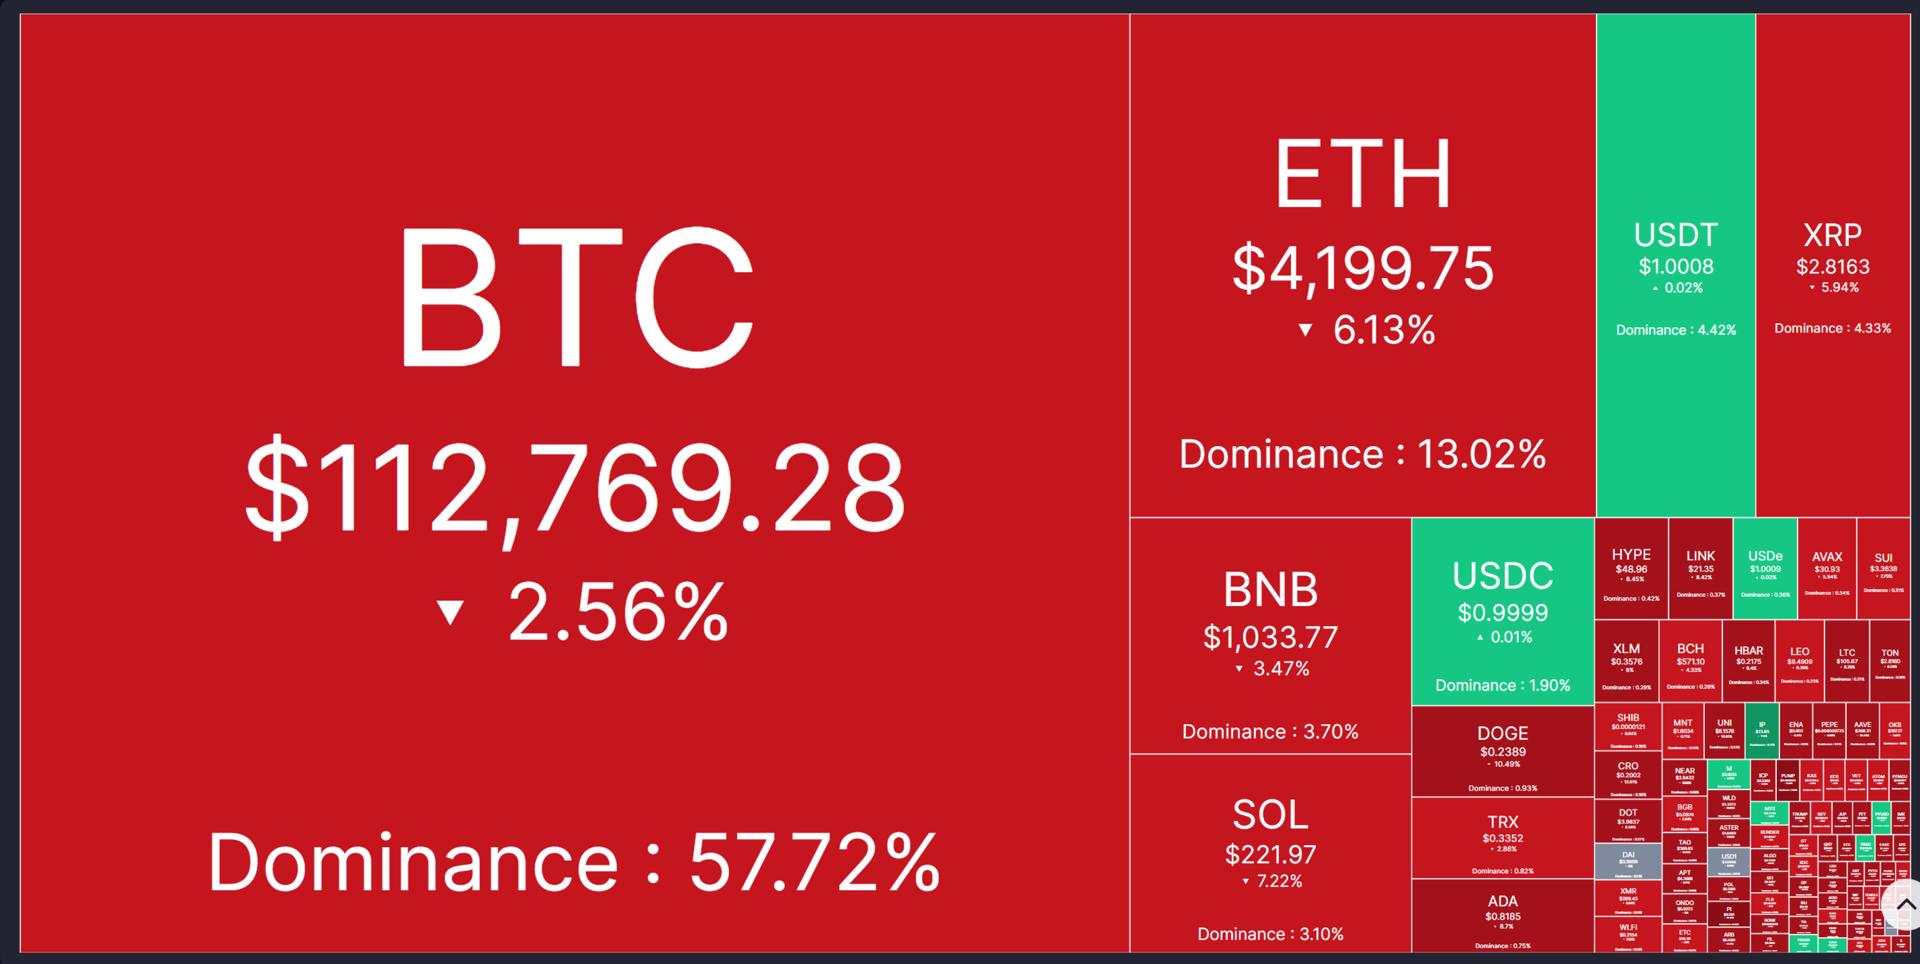
As a
result, cryptocurrency prices have fallen to their lowest levels in more than a
month, extending declines for four and in some cases five consecutive sessions.
Red dominates the market, as shown on the cryptocurrency heatmap from
CoinMarketCap:
Bitcoin
slipped below the psychologically important $115,000 level, trading at $112,840
after touching session lows near $111,760. The world’s largest cryptocurrency
retreated from September highs above $117,000, testing the lower boundary of
its consolidation range that has defined trading since July.
From my
technical analysis, Bitcoin’s break below its 50-day moving average at $115,000
signals potential further declines toward the $105,000 support zone, which
coincides with a 38.2% Fibonacci retracement and the 200-day exponential moving
average. According to my technical view, even if Bitcoin exits its current
consolidation, this level represents very strong support.
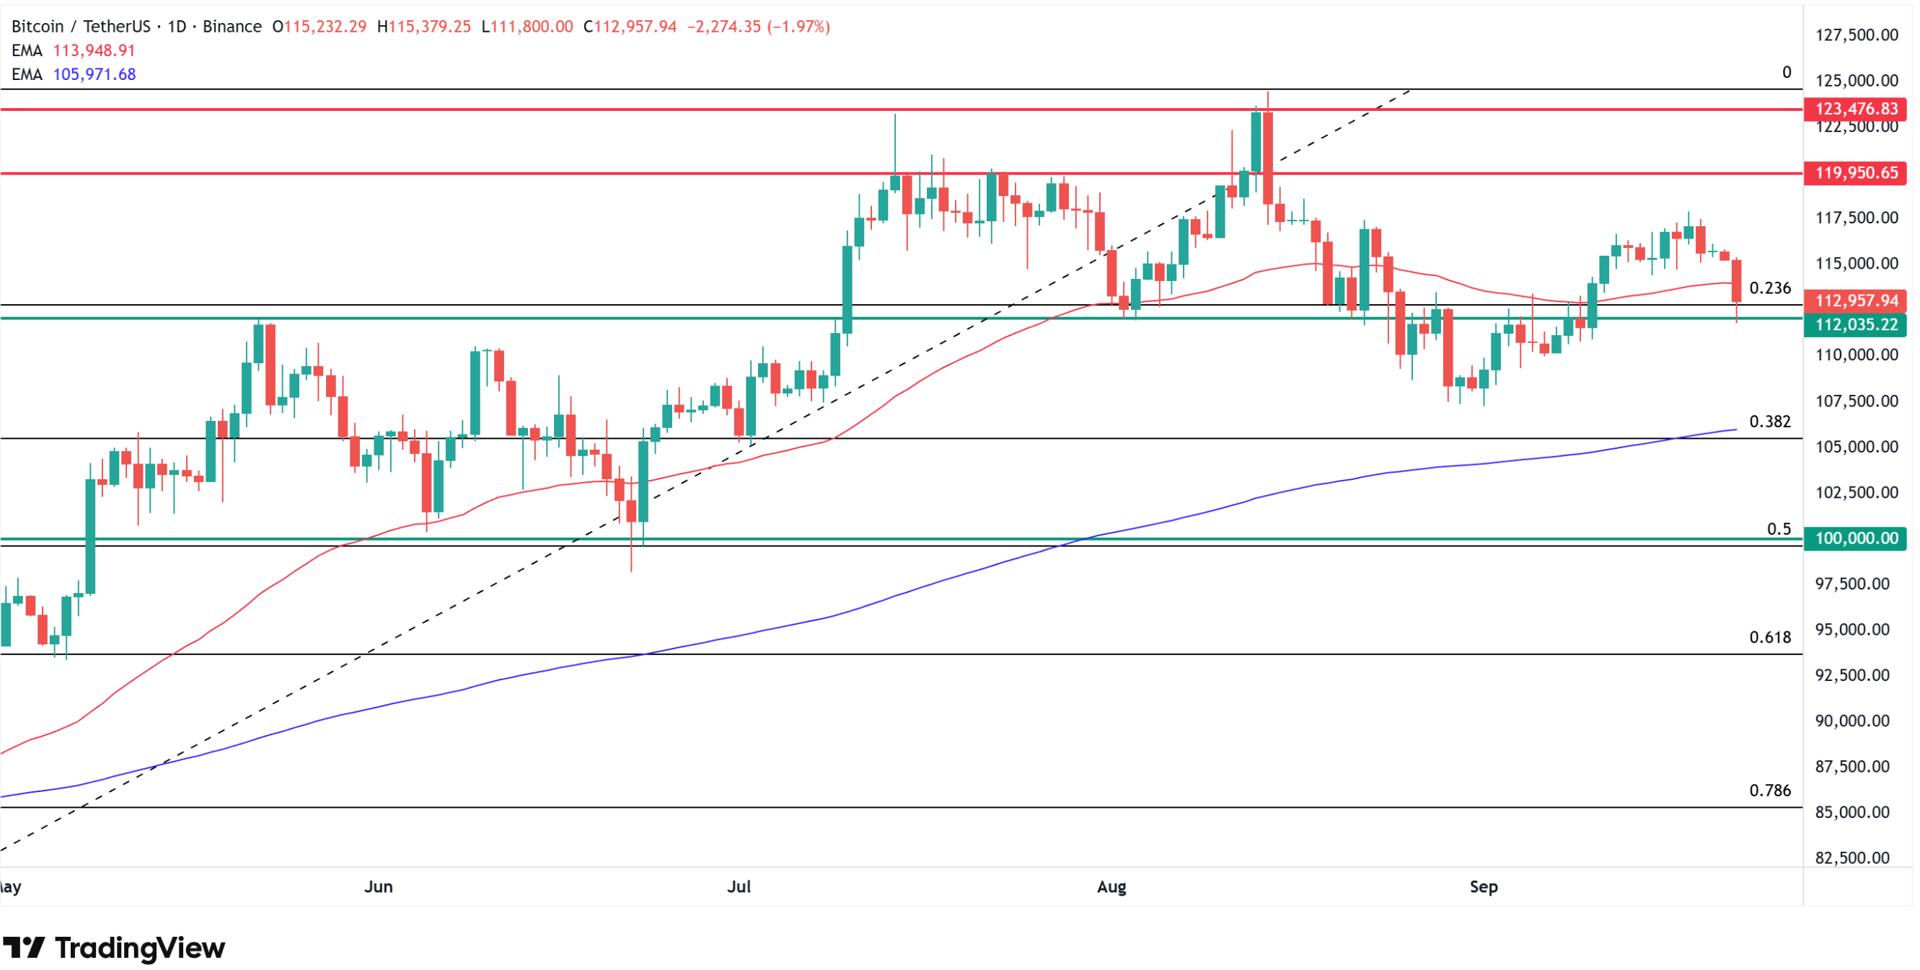
The current
selloff reflects profit-taking after September’s “Uptober” rally,
with on-chain data showing large holders moving significant Bitcoin volumes to
exchanges: a classic indicator of profit realization. Bitcoin is holding within
its established trading channel between $112,000 and $120,000, which has been
temporarily breached both higher in August and lower in early September.
Ethereum Violates Key
Moving Averages
Ethereum
faced more severe pressure, with the second-largest digital asset by market
capitalization dropping to around $4,100 during Monday’s session, its lowest
level in over a month. The sharp decline violated Ethereum’s 50-day exponential
moving average and September lows, though some of the selling was corrected as
ETH recovered to trade near $4,200, still down more than 5% on the day.
According
to my technical analysis, the cryptocurrency has pulled significantly away from
August highs tested on August 13 near $4,800. Despite Monday’s weakness, from
my technical view, Ethereum remains within the same consolidation channel
observed since early August, trading between support at $4,060 and resistance
at $4,800—a range representing approximately 17% volatility spread.
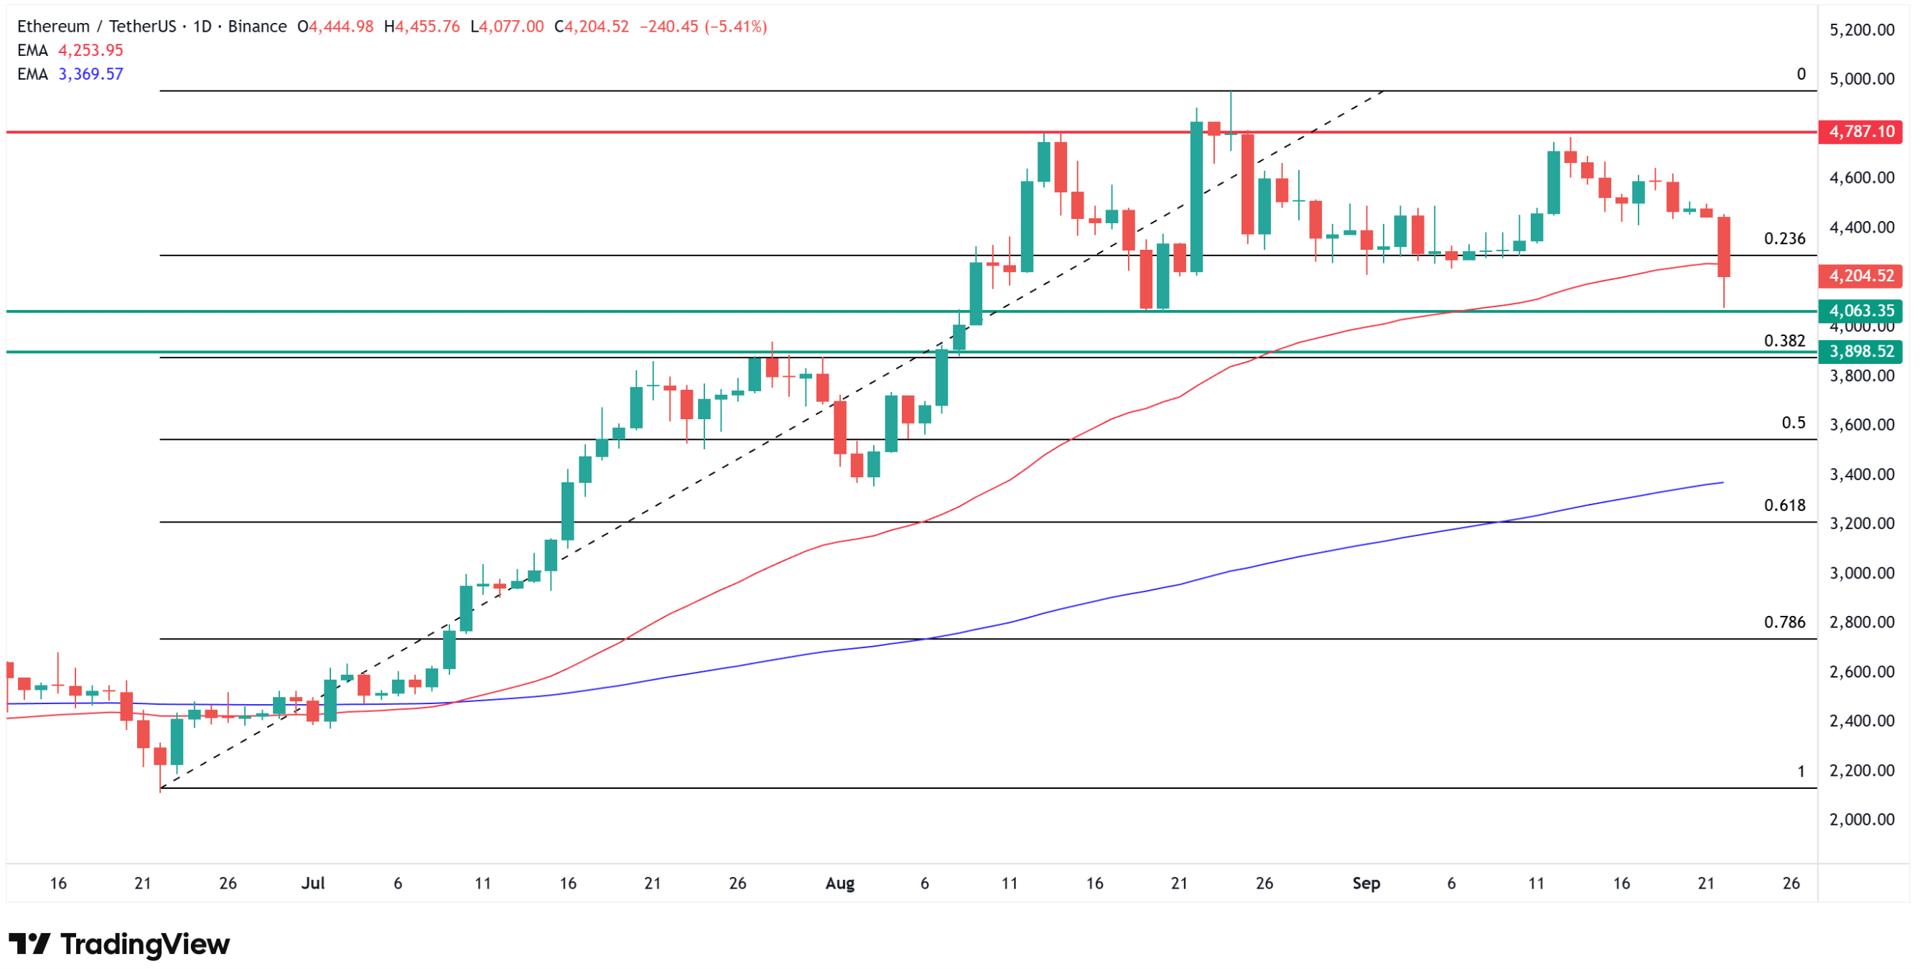
The current
price action suggests Ethereum is testing the lower boundary of this
established range, with the next critical support level sitting at the $4,060
zone that has been defended multiple times since August.
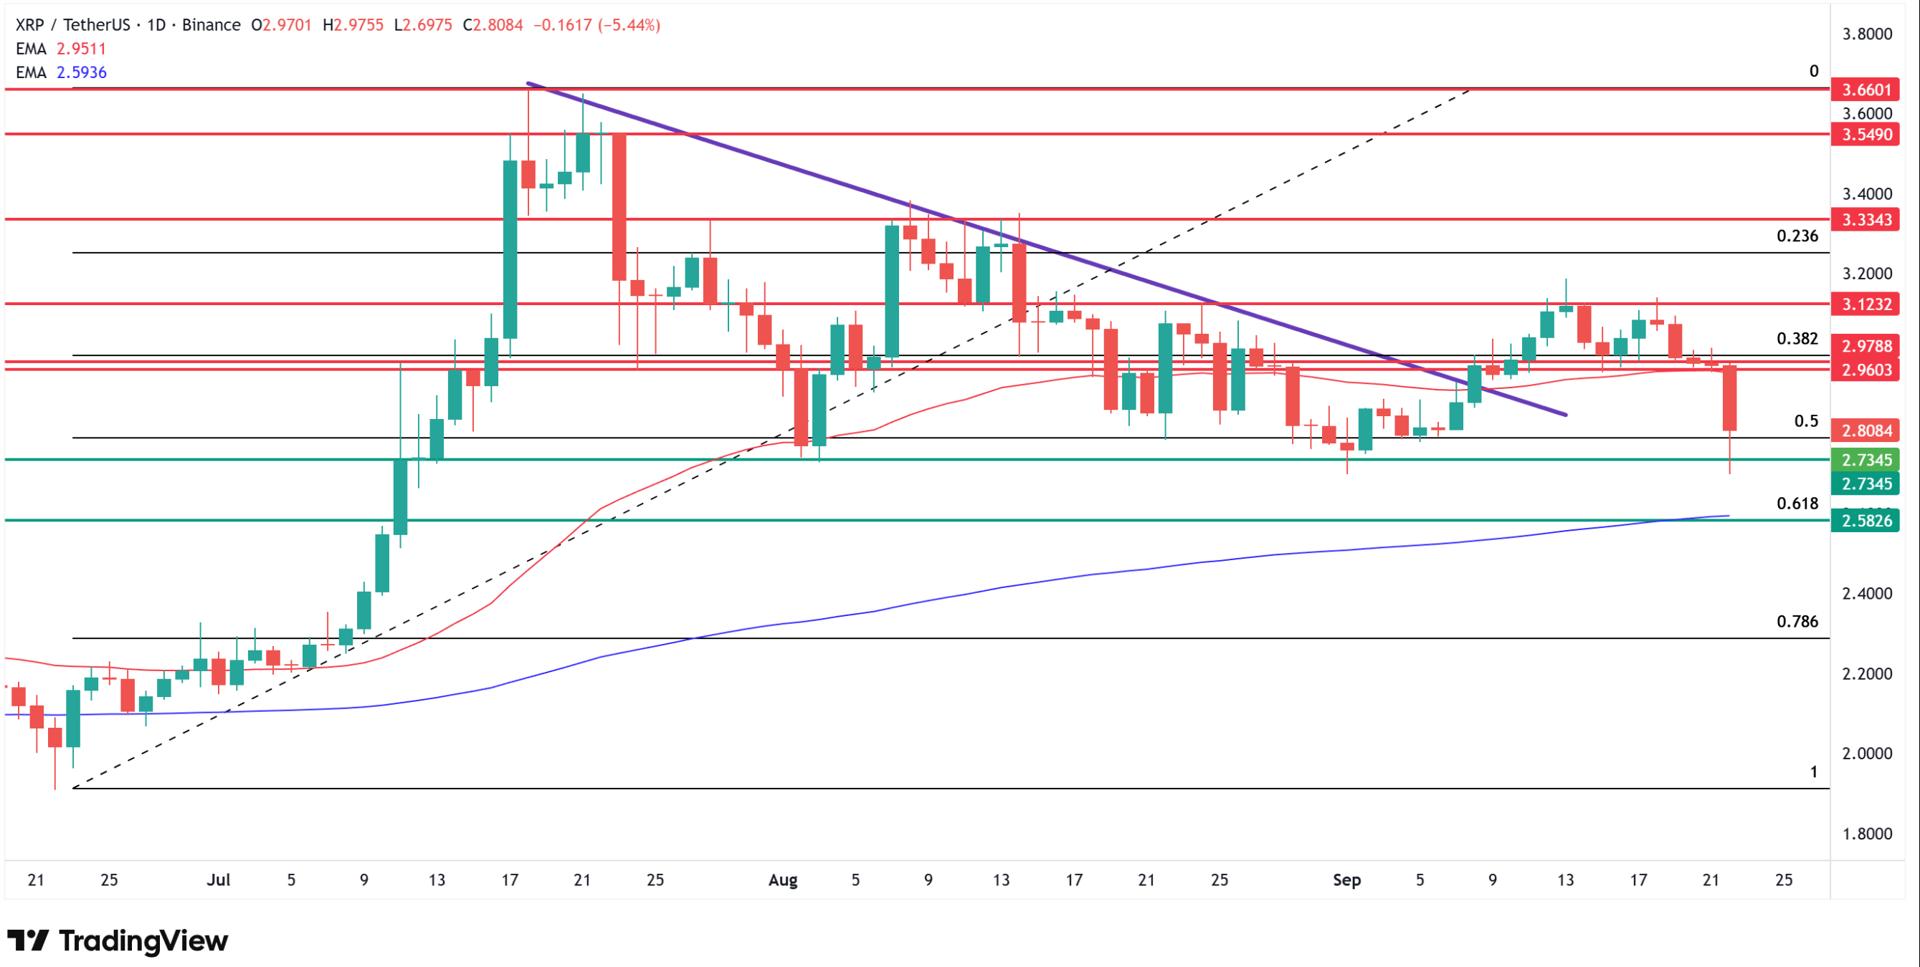
XRP Approaches Multi-Month
Support Zone
XRP price emerged
as one of Monday’s worst performers among major cryptocurrencies, sliding for
the fifth consecutive session to test levels below $2.70. The decline marked
XRP’s lowest point since early September and coincided with levels last seen in
early July, representing a two-month low.
Over less
than a week, XRP has declined from local resistance at $3.12 and September
highs to the lower boundary of its consolidation range that has been tested
three times since early August. From my technical analysis, this
support zone aligns with a 50% Fibonacci retracement and local highs from the
2024-2025 transition period, typically functioning as strong support.
According
to my technical view, just below this level lies the 200-day exponential moving
average combined with the $2.58 level and 61.8% Fibonacci retracement, creating
a broader support zone that should help defend XRP against stronger
depreciation. This confluence of technical indicators suggests a critical
juncture for the token.
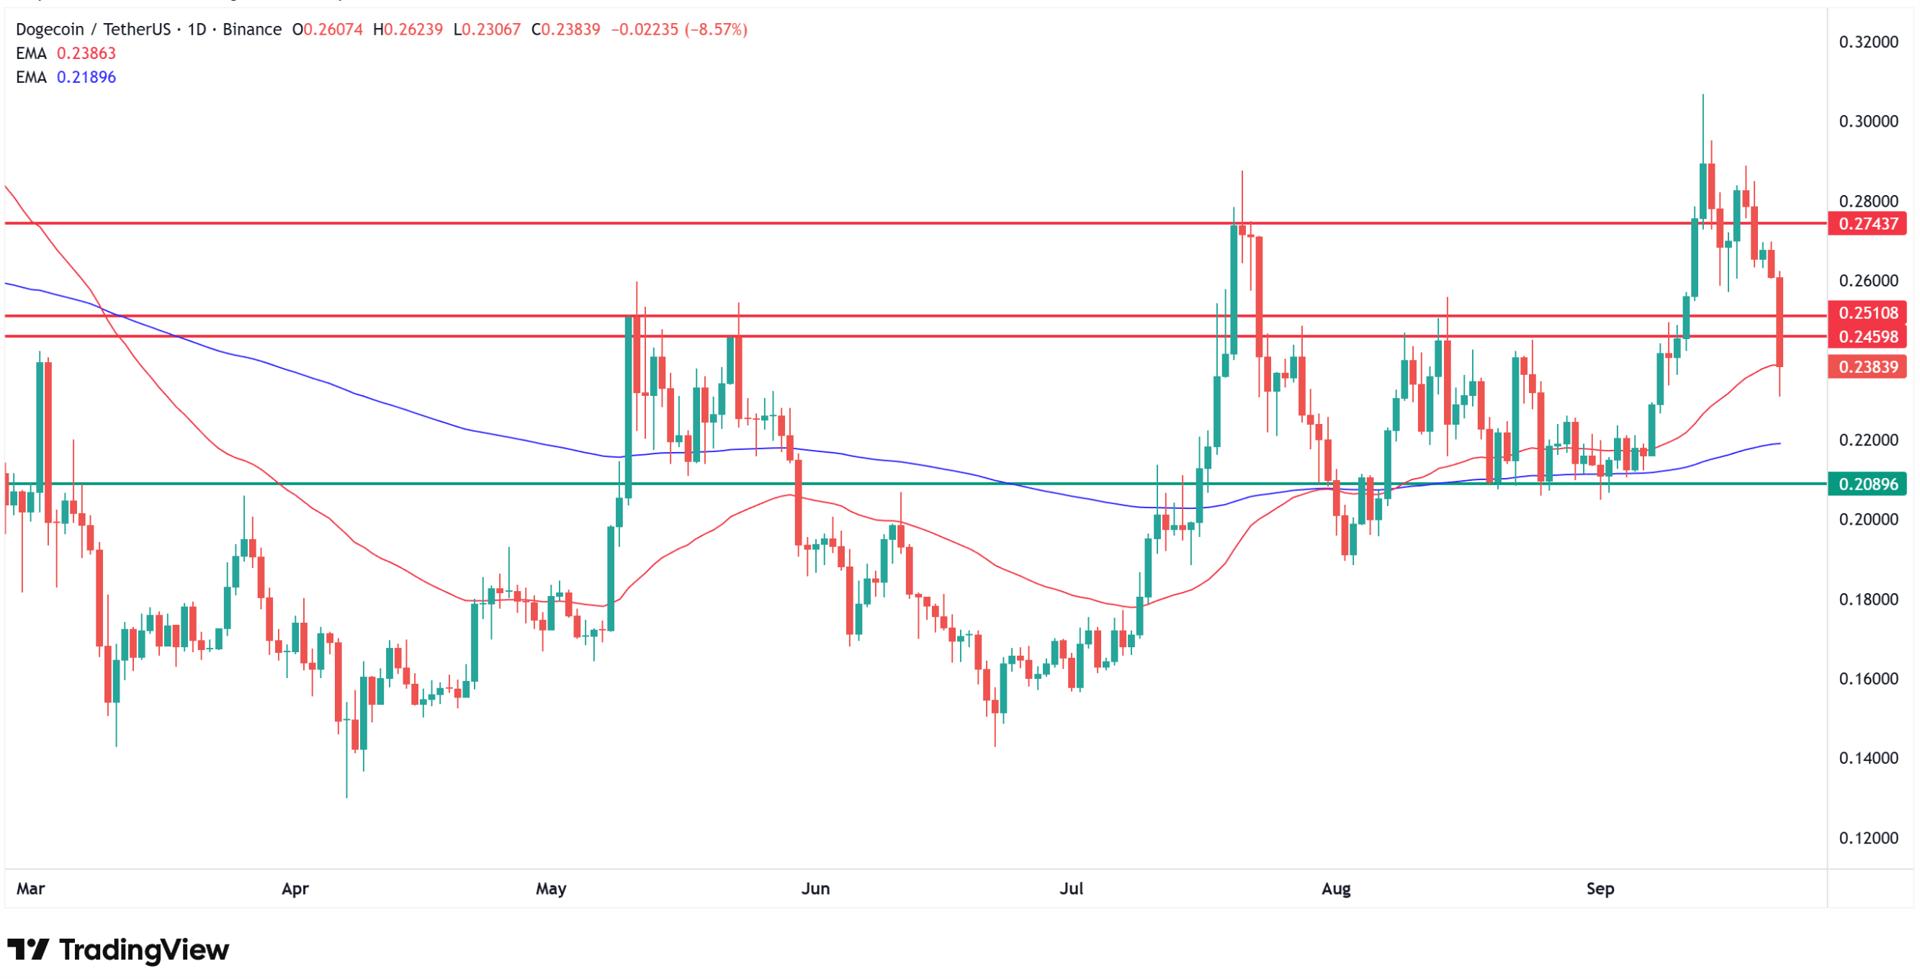
Dogecoin Suffers Steepest
Decline Among Major Cryptos
Among the
four major cryptocurrencies analyzed, Dogecoin posted the largest losses. The
meme token fell more than 10% at one point during Monday’s session to just 23
cents, though it found support at the 50-day exponential moving average.
Currently trading down 8.6% near 24 cents, with an exact valuation of $0.2384.
Dogecoin
had surged strongly in September, briefly reaching 31 cents—the highest level
since the beginning of the year. However, it has sharply corrected and according
to my technical analysis, is now returning to the consolidation range
observed throughout most of August, which spans between 21 cents and a
resistance zone around 25 cents.
From my
technical view, the current price action suggests significant risk that
Dogecoin could approach the lower boundary of this consolidation range. The
50-day exponential moving average provided temporary support during Monday’s
decline, but sustained selling pressure could push the token toward the 21-cent
floor established in August.
Seasonal Patterns Offer
Hope
Despite
near-term weakness, from my technical analysis, historical patterns
suggest potential for recovery. “While near-term weakness is possible
between now and month-end, the market is also entering what is historically the
strongest quarter of the year for crypto,” Kruger observed.
According
to market analysis, seasonally favorable flows and positioning have often set
the stage for powerful year-end rallies. “Fresh record highs in both Bitcoin and ether remain in view if the macro backdrop cooperates,” the
LMAX strategist added.
However,
Kruger cautioned that “sustained dollar strength or geopolitical
developments—ranging from U.S. regulatory moves to broader global political
tensions—could further test crypto’s resilience.”
From my
technical analysis, the key levels to watch include Bitcoin’s $105,000 support
zone, Ethereum’s $4,060 consolidation floor, XRP’s $2.58-$2.70 support band,
and Dogecoin’s 21-cent August low. These technical boundaries will likely
determine whether the current correction represents healthy consolidation or
the beginning of a deeper bear phase.
“For
now, however, the balance of risks leans toward consolidation or modest
downside unless Bitcoin can decisively clear overhead resistance,” Kruger
concluded.
Read my other posts and analysis related to the cryptocurrency market:
FAQ
Why does the crypto market
go down?
The crypto
market declines due to multiple interconnected factors. Macroeconomic
conditions play a crucial role: when central banks raise interest rates,
borrowing becomes more expensive and reduces liquidity in financial markets,
leading to lower investment in risky assets like crypto. Market sentiment and
speculation also drive volatility, as prices are often influenced more by
investor emotions than intrinsic value. Regulatory developments create
uncertainty, with crackdowns or proposed regulations often triggering panic
selling.
Will crypto rise again?
Historical
patterns suggest crypto markets tend to recover from downturns, particularly
during the fourth quarter which has traditionally been the strongest period for
digital assets. Seasonally favorable flows and institutional positioning often
set the stage for year-end rallies, with fresh record highs remaining possible
if macroeconomic conditions cooperate. However, recovery depends on factors
including Federal Reserve policy clarity, regulatory developments, and overall
market sentiment toward risk assets.
What is the 30 day rule in
crypto?
The 30-day
rule, also known as the wash sale rule, prevents investors from claiming tax
losses while immediately repurchasing the same asset. However, most
cryptocurrencies are currently exempt from this rule since they’re not legally
defined as securities by tax authorities. In traditional markets, investors
must wait 30 days after selling an asset at a loss before buying it back to
claim the tax deduction.
What does Warren Buffett
say about crypto?
Warren
Buffett has been consistently critical of cryptocurrency, famously calling
Bitcoin “rat poison squared” at Berkshire Hathaway’s 2018 annual
meeting. At the 2022 shareholder meeting, he stated: “If you told me you
owned all of the bitcoin in the world and you offered it to me for $25, I
wouldn’t take it because what would I do with it? I’d have to sell it back to
you one way or another. It isn’t going to do anything”. Buffett believes
cryptocurrencies lack intrinsic value and don’t produce concrete returns like
traditional investments.
Digital
asset prices tumbled across the board today (Monday), with Bitcoin (BTC) and
Ethereum (ETH) leading a broad-based selloff that sent major cryptocurrencies
toward multi-week lows as technical levels crumbled and profit-taking
accelerated.
The
cryptocurrency market’s total capitalization fell by $77 billion during
Monday’s session, with more than 400,000 traders facing liquidations worth $1.7
billion combined. Market sentiment has turned decidedly cautious as traders
reassess positioning ahead of month-end.
Why are
cryptocurrencies falling? In this article, I address that question by analyzing
technical charts for XRP/USDT, BTC/USDT, DOGE/USDT, and ETH/USDT.
Several
macro factors have contributed to the selloff. While last week’s Federal
Reserve rate cut to 4.00-4.25% initially supported risk assets, Chair Powell’s
cautious stance on inflation has tempered expectations for rapid easing.
“As a result, traders have been reluctant to extend crypto’s recent rally
without fresh macro catalysts,” explained Joel Kruger, FX and crypto
strategist at LMAX Group.
“The
market tone has turned cautious, perhaps on the back of renewed outperformance
in the price of Bitcoin relative to ETH, signaling a flight to quality,” he
added. “Some profit taking is also likely at play after an impressive
September rally, unusual for a month that has historically been one of
bitcoin’s weakest.”
The
strategist pointed to upcoming economic data as key market drivers:
“Investors are watching upcoming PCE inflation data and a heavy slate of
Fed commentary this week, both of which could reprice rate-cut expectations and
influence liquidity conditions.”
As a
result, cryptocurrency prices have fallen to their lowest levels in more than a
month, extending declines for four and in some cases five consecutive sessions.
Red dominates the market, as shown on the cryptocurrency heatmap from
CoinMarketCap:
Bitcoin
slipped below the psychologically important $115,000 level, trading at $112,840
after touching session lows near $111,760. The world’s largest cryptocurrency
retreated from September highs above $117,000, testing the lower boundary of
its consolidation range that has defined trading since July.
From my
technical analysis, Bitcoin’s break below its 50-day moving average at $115,000
signals potential further declines toward the $105,000 support zone, which
coincides with a 38.2% Fibonacci retracement and the 200-day exponential moving
average. According to my technical view, even if Bitcoin exits its current
consolidation, this level represents very strong support.
The current
selloff reflects profit-taking after September’s “Uptober” rally,
with on-chain data showing large holders moving significant Bitcoin volumes to
exchanges: a classic indicator of profit realization. Bitcoin is holding within
its established trading channel between $112,000 and $120,000, which has been
temporarily breached both higher in August and lower in early September.
Ethereum Violates Key
Moving Averages
Ethereum
faced more severe pressure, with the second-largest digital asset by market
capitalization dropping to around $4,100 during Monday’s session, its lowest
level in over a month. The sharp decline violated Ethereum’s 50-day exponential
moving average and September lows, though some of the selling was corrected as
ETH recovered to trade near $4,200, still down more than 5% on the day.
According
to my technical analysis, the cryptocurrency has pulled significantly away from
August highs tested on August 13 near $4,800. Despite Monday’s weakness, from
my technical view, Ethereum remains within the same consolidation channel
observed since early August, trading between support at $4,060 and resistance
at $4,800—a range representing approximately 17% volatility spread.
The current
price action suggests Ethereum is testing the lower boundary of this
established range, with the next critical support level sitting at the $4,060
zone that has been defended multiple times since August.
XRP Approaches Multi-Month
Support Zone
XRP price emerged
as one of Monday’s worst performers among major cryptocurrencies, sliding for
the fifth consecutive session to test levels below $2.70. The decline marked
XRP’s lowest point since early September and coincided with levels last seen in
early July, representing a two-month low.
Over less
than a week, XRP has declined from local resistance at $3.12 and September
highs to the lower boundary of its consolidation range that has been tested
three times since early August. From my technical analysis, this
support zone aligns with a 50% Fibonacci retracement and local highs from the
2024-2025 transition period, typically functioning as strong support.
According
to my technical view, just below this level lies the 200-day exponential moving
average combined with the $2.58 level and 61.8% Fibonacci retracement, creating
a broader support zone that should help defend XRP against stronger
depreciation. This confluence of technical indicators suggests a critical
juncture for the token.
Dogecoin Suffers Steepest
Decline Among Major Cryptos
Among the
four major cryptocurrencies analyzed, Dogecoin posted the largest losses. The
meme token fell more than 10% at one point during Monday’s session to just 23
cents, though it found support at the 50-day exponential moving average.
Currently trading down 8.6% near 24 cents, with an exact valuation of $0.2384.
Dogecoin
had surged strongly in September, briefly reaching 31 cents—the highest level
since the beginning of the year. However, it has sharply corrected and according
to my technical analysis, is now returning to the consolidation range
observed throughout most of August, which spans between 21 cents and a
resistance zone around 25 cents.
From my
technical view, the current price action suggests significant risk that
Dogecoin could approach the lower boundary of this consolidation range. The
50-day exponential moving average provided temporary support during Monday’s
decline, but sustained selling pressure could push the token toward the 21-cent
floor established in August.
Seasonal Patterns Offer
Hope
Despite
near-term weakness, from my technical analysis, historical patterns
suggest potential for recovery. “While near-term weakness is possible
between now and month-end, the market is also entering what is historically the
strongest quarter of the year for crypto,” Kruger observed.
According
to market analysis, seasonally favorable flows and positioning have often set
the stage for powerful year-end rallies. “Fresh record highs in both Bitcoin and ether remain in view if the macro backdrop cooperates,” the
LMAX strategist added.
However,
Kruger cautioned that “sustained dollar strength or geopolitical
developments—ranging from U.S. regulatory moves to broader global political
tensions—could further test crypto’s resilience.”
From my
technical analysis, the key levels to watch include Bitcoin’s $105,000 support
zone, Ethereum’s $4,060 consolidation floor, XRP’s $2.58-$2.70 support band,
and Dogecoin’s 21-cent August low. These technical boundaries will likely
determine whether the current correction represents healthy consolidation or
the beginning of a deeper bear phase.
“For
now, however, the balance of risks leans toward consolidation or modest
downside unless Bitcoin can decisively clear overhead resistance,” Kruger
concluded.
Read my other posts and analysis related to the cryptocurrency market:
FAQ
Why does the crypto market
go down?
The crypto
market declines due to multiple interconnected factors. Macroeconomic
conditions play a crucial role: when central banks raise interest rates,
borrowing becomes more expensive and reduces liquidity in financial markets,
leading to lower investment in risky assets like crypto. Market sentiment and
speculation also drive volatility, as prices are often influenced more by
investor emotions than intrinsic value. Regulatory developments create
uncertainty, with crackdowns or proposed regulations often triggering panic
selling.
Will crypto rise again?
Historical
patterns suggest crypto markets tend to recover from downturns, particularly
during the fourth quarter which has traditionally been the strongest period for
digital assets. Seasonally favorable flows and institutional positioning often
set the stage for year-end rallies, with fresh record highs remaining possible
if macroeconomic conditions cooperate. However, recovery depends on factors
including Federal Reserve policy clarity, regulatory developments, and overall
market sentiment toward risk assets.
What is the 30 day rule in
crypto?
The 30-day
rule, also known as the wash sale rule, prevents investors from claiming tax
losses while immediately repurchasing the same asset. However, most
cryptocurrencies are currently exempt from this rule since they’re not legally
defined as securities by tax authorities. In traditional markets, investors
must wait 30 days after selling an asset at a loss before buying it back to
claim the tax deduction.
What does Warren Buffett
say about crypto?
Warren
Buffett has been consistently critical of cryptocurrency, famously calling
Bitcoin “rat poison squared” at Berkshire Hathaway’s 2018 annual
meeting. At the 2022 shareholder meeting, he stated: “If you told me you
owned all of the bitcoin in the world and you offered it to me for $25, I
wouldn’t take it because what would I do with it? I’d have to sell it back to
you one way or another. It isn’t going to do anything”. Buffett believes
cryptocurrencies lack intrinsic value and don’t produce concrete returns like
traditional investments.
Search
RECENT PRESS RELEASES
Strategy Shares Fall After Bitcoin Giant Reveals $100 Million BTC Buy
SWI Editorial Staff2025-09-22T09:32:08-07:00September 22, 2025|
New rout in bitcoin ripples through crypto world today
SWI Editorial Staff2025-09-22T09:31:42-07:00September 22, 2025|
Bitcoin, Ethereum ETFs Drew $1.9 Billion in Assets Last Week Amid Rate Cut Optimism
SWI Editorial Staff2025-09-22T09:31:14-07:00September 22, 2025|
How soon will crypto creep into your 401(k)? New rules being explored now
SWI Editorial Staff2025-09-22T09:30:49-07:00September 22, 2025|
Strive Asset Management to Acquire Semler Scientific, $567 Million in Bitcoin in All-Cash
SWI Editorial Staff2025-09-22T09:30:19-07:00September 22, 2025|
Capital B Acquires 551 Bitcoin Raising Total to 2,800
SWI Editorial Staff2025-09-22T09:29:27-07:00September 22, 2025|
Related Post


