Why Crypto Is Going Up? Bitcoin And Ethereum Price Rally for 5th Straight Session, XRP, Do
October 27, 2025
Cryptocurrency
markets extended their winning streak for a fifth consecutive session today
(Monday), 27 October 20205, as Bitcoin price surged past $115,000 and Ethereum
reclaimed the critical $4,200 level, with the rally fueled by easing US-China
trade tensions and growing expectations for Federal Reserve rate cuts.
In this
article, I analyze four charts – BTC/USDT, ETH/USDT, XRP/USDT and DOGE/USDT –
drawing on more than 10 years of experience as an investor and technical
analyst to explore why cryptocurrency prices are surging.
Total
cryptocurrency market capitalization climbed approximately 1.9% to $3.92
trillion as investors positioned ahead of the Fed’s October 29 meeting, where
there’s a 98.3% probability of a 25-basis-point rate cut according to
CME’s FedWatch Tool.
|
5-Day Crypto Rally Performance |
Oct 22 Start |
Oct 27 Current |
Gain % |
Key Level Broken |
|
Bitcoin (BTC) |
$111,032 |
$115,956 |
+4.4% |
$114,176 (50-day MA) |
|
Ethereum (ETH) |
$3,950 |
$4,253 |
+7.7% |
$4,070 (August lows) |
|
Total Market Cap |
$3.85T |
$3.92T |
+1.9% |
— |
|
Short Liquidations |
— |
$319M |
— |
24-hour cascade |
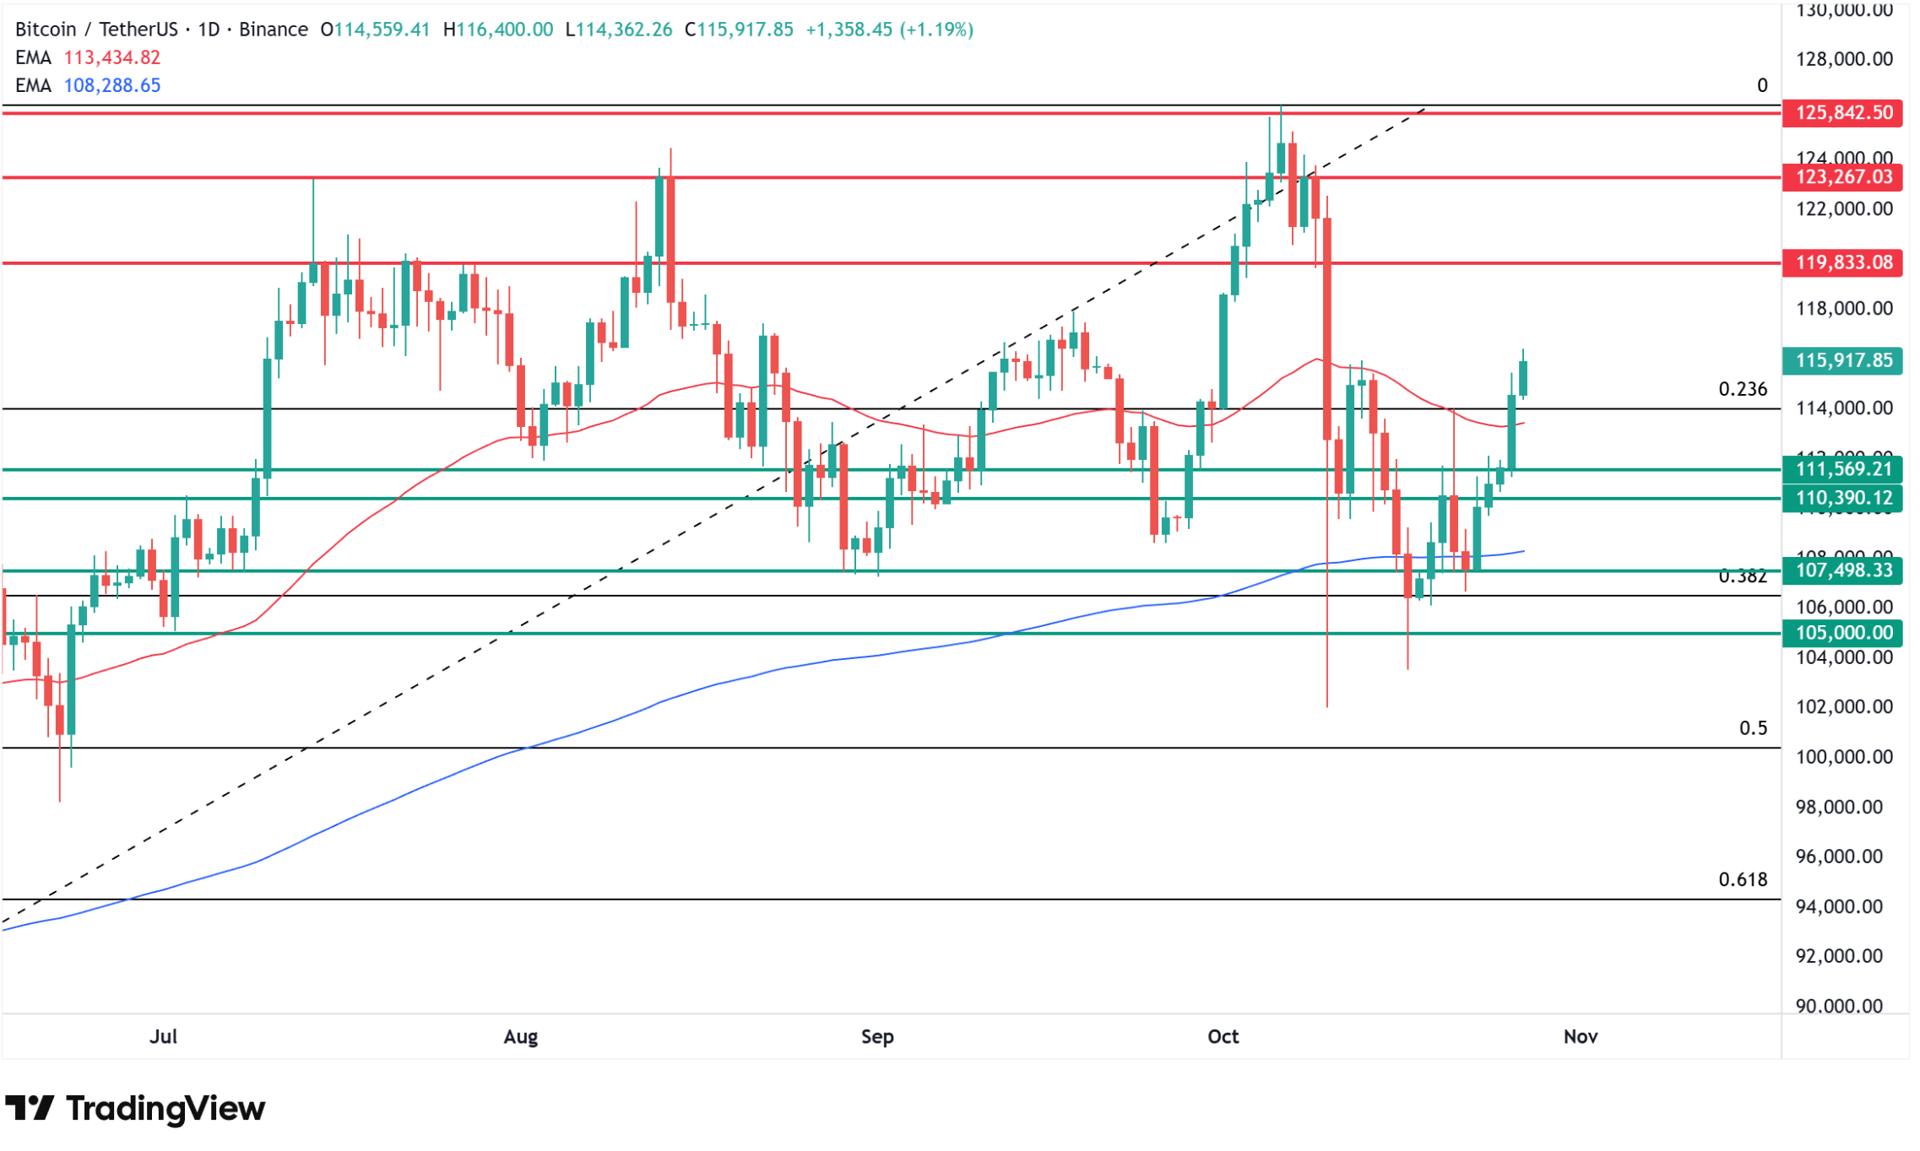
Bitcoin
traded at $115,956 at 8:17 AM CET Monday, gaining 1.22% daily after Sunday’s
2.6% surge that broke through the 50-day exponential moving average at
$114,176. The cryptocurrency has now recovered nearly half of the losses from
the October 10 crash that sent prices tumbling to $103,000, demonstrating
remarkable resilience as bulls target a retest of the $120,000 level.
US-China Trade Framework
Sparks Weekend Rally
The
cryptocurrency surge accelerated over the weekend following the announcement of
a US-China trade framework agreement reached during two days of negotiations in
Malaysia on October 26. US Treasury Secretary Scott Bessent stated that
negotiators achieved a “very substantial framework” that could
prevent threatened 100% US tariffs and secure a pause on China’s rare-earth
export restrictions.
Joel
Kruger, strategist at LMAX, emphasized that “the recent rebound in crypto
has been supported by an improving macro backdrop—particularly softer U.S. CPI
data that has reinforced expectations for Federal Reserve rate cuts and a more
accommodative policy stance.” He added that “together with easing
yields and stronger risk sentiment, this has provided a catalyst for renewed
demand across digital assets heading into year-end.”
I also invite you to check my previous Bitcoin, crypto and metals analyses:
Bitcoin Technical Breakout
Opens Path to $120K
According
to my technical analysis, Bitcoin (BTC) price is climbing for a fifth
consecutive session, with Sunday’s 2.6% gain breaking through the 50-day
exponential moving average at $114,176. Monday’s additional 1% advance
establishes two-week highs at $115,647, with the cryptocurrency reclaiming the
23.6% Fibonacci retracement and opening the path toward a retest of the
psychologically significant $120,000 level marked by July highs.
Breaking
through this $120,000 zone would open the door toward $123,000 and subsequently
$126,000, representing the all-time highs established on August 1 and October 5,
respectively. Although Bitcoin experienced turbulence in early October,
including a single-day 7% decline, the cryptocurrency found support at the
200-day exponential moving average (200 EMA) at $108,639, with a double-bottom
formation providing the platform for the current decisive bounce and return to
upward momentum.
In my view,
Bitcoin could return to price discovery mode before year-end, establishing new
all-time highs and climbing further north.
Derivatives
data from CoinGlass showed $319.18 million in short liquidations over
24 hours through Sunday, indicating bearish positions were squeezed as the
breakout accelerated. Trading volume jumped approximately 318% above session
average during the initial surge past $112,000, confirming genuine buying
interest rather than thin liquidity driving the move.
You may also like: This Trading Giant Who Called Bitcoin’s 2025 Peak Just Made Another Bold 420% Price Prediction
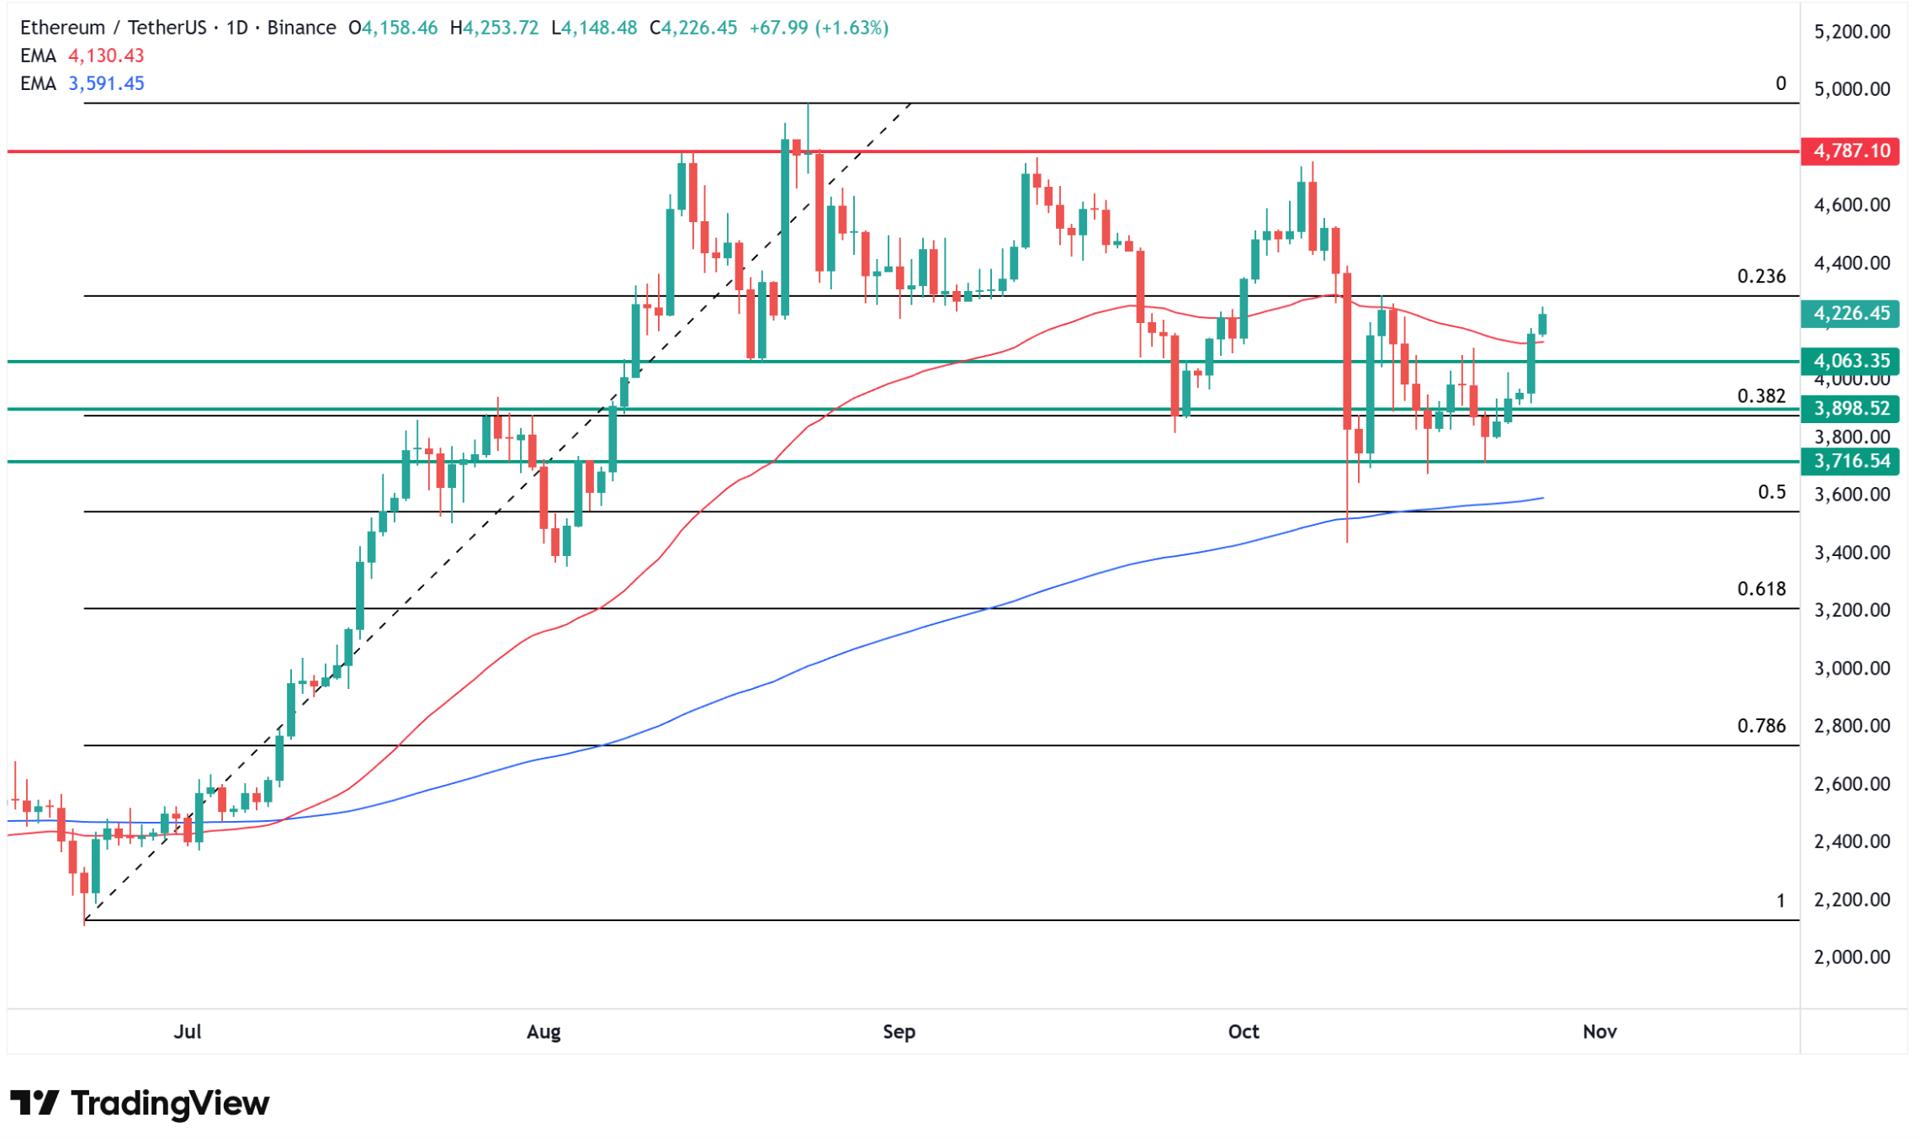
Ethereum Surges Past
$4,200 After Testing 200 EMA
From my
technical analysis of the Ethereum (ETH) price chart, the cryptocurrency is
rising for a fifth straight session, and after a very strong Sunday surge of
over 5%, it added another 2% Monday, testing intraday levels at $4,253. Most
significantly, Ethereum broke above the 50-day exponential moving average (50
EMA) for the first time in over two weeks, returning above the psychologically
important $4,000 level and the resistance marked by mid-August lows.
As a
result, Ethereum now has room to bounce toward this year’s highs drawn around
the $4,800 level, established by August highs and subsequently tested four more
times. A stronger base for Ethereum ‘s rebound was provided by testing the
200-day exponential moving average (200 EMA) and 50% Fibonacci retracement from
the first part of the month, along with local support in the form of a double
bottom drawn in recent weeks around $3,700.
Kruger
noted that “from a technical standpoint, the outlook remains constructive.
The recent pullback in bitcoin and ether appears to be a healthy consolidation
phase following fresh record highs against the U.S. dollar.” He expects
“these markets to remain well supported on dips, paving the way for
another leg higher into year-end.”
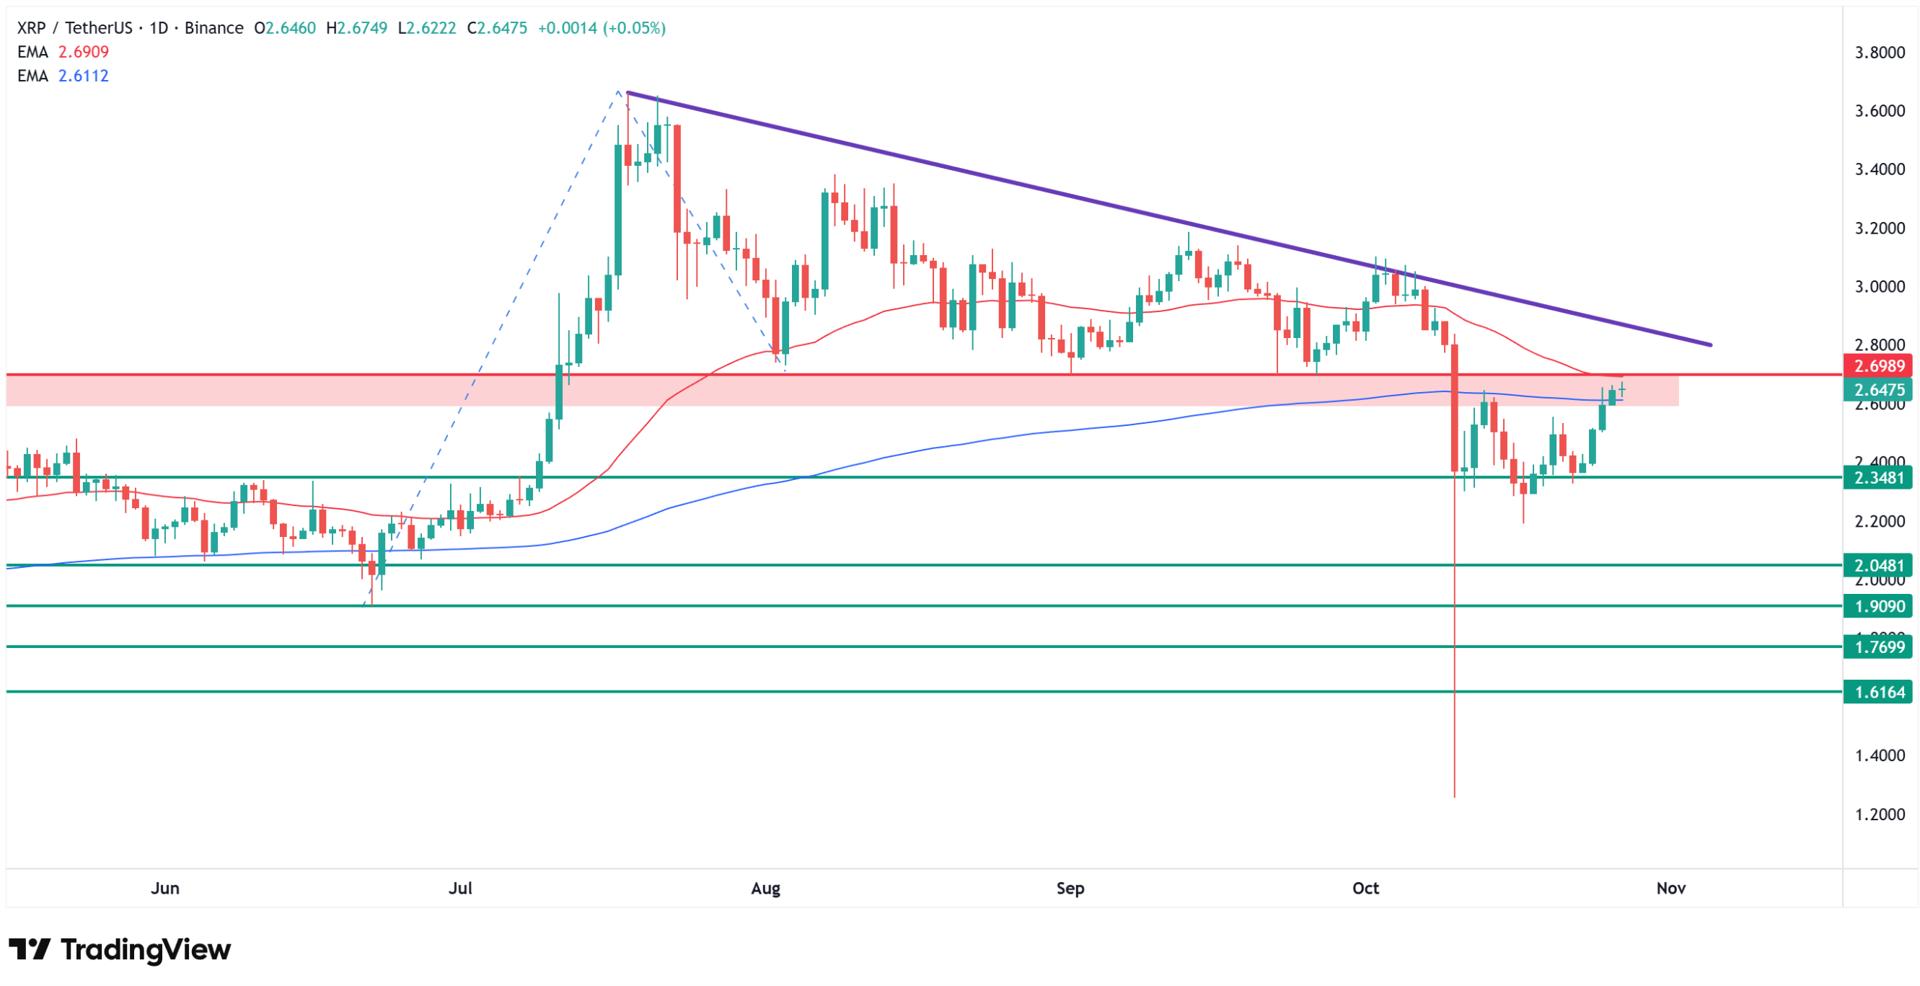
XRP Consolidates Below Key
Resistance Despite Rally
Although
XRP is rising for a fifth consecutive session just like Ethereum and Bitcoin ,
according to my technical analysis the chart sits in a somewhat worse position
following strong 15% declines from early October that broke a wedge formation
and entered consolidation at levels last tested in July. Support was
established in the $2.20-$2.35 range, while resistance sits in the $2.60-$2.70
zone, additionally strengthened by the 50 EMA and 200 EMA.
Until XRP
breaks through this resistance zone, in my view, the price remains under
pressure and could decline again to $2.35, or even further toward June lows
around the psychologically round $2.00 level. The cryptocurrency needs to
reclaim the moving average grid and push decisively above $2.70 to invalidate the
bearish technical setup and open the path toward higher targets.
XRP price prediction: This XRP Price Prediction From Ex-Goldman Analyst Eyes $1,000 by 2030
Dogecoin Faces Death Cross
Warning
Dogecoin
(DOGE) price, unlike the cryptocurrencies described above, is not rising for a
fifth consecutive session. However, it gained nearly 5% Sunday and added
another 1% Monday, establishing session highs at $0.2095. This doesn’t change
the fact that price continues consolidating at August levels below an important
resistance zone marked by lows also from that month around $0.21.
It’s worth
emphasizing that the 50-day moving average has practically crossed below the
200 EMA from above, which for technical analysis enthusiasts like myself
represents a very strong signal that could push Dogecoin’s price significantly
lower from current levels. My target downside level would be around
$0.14—representing June 20 lows this year and marking the beginning of the
current cycle for Dogecoin, which extends up to peaks tested in September
around $0.30.
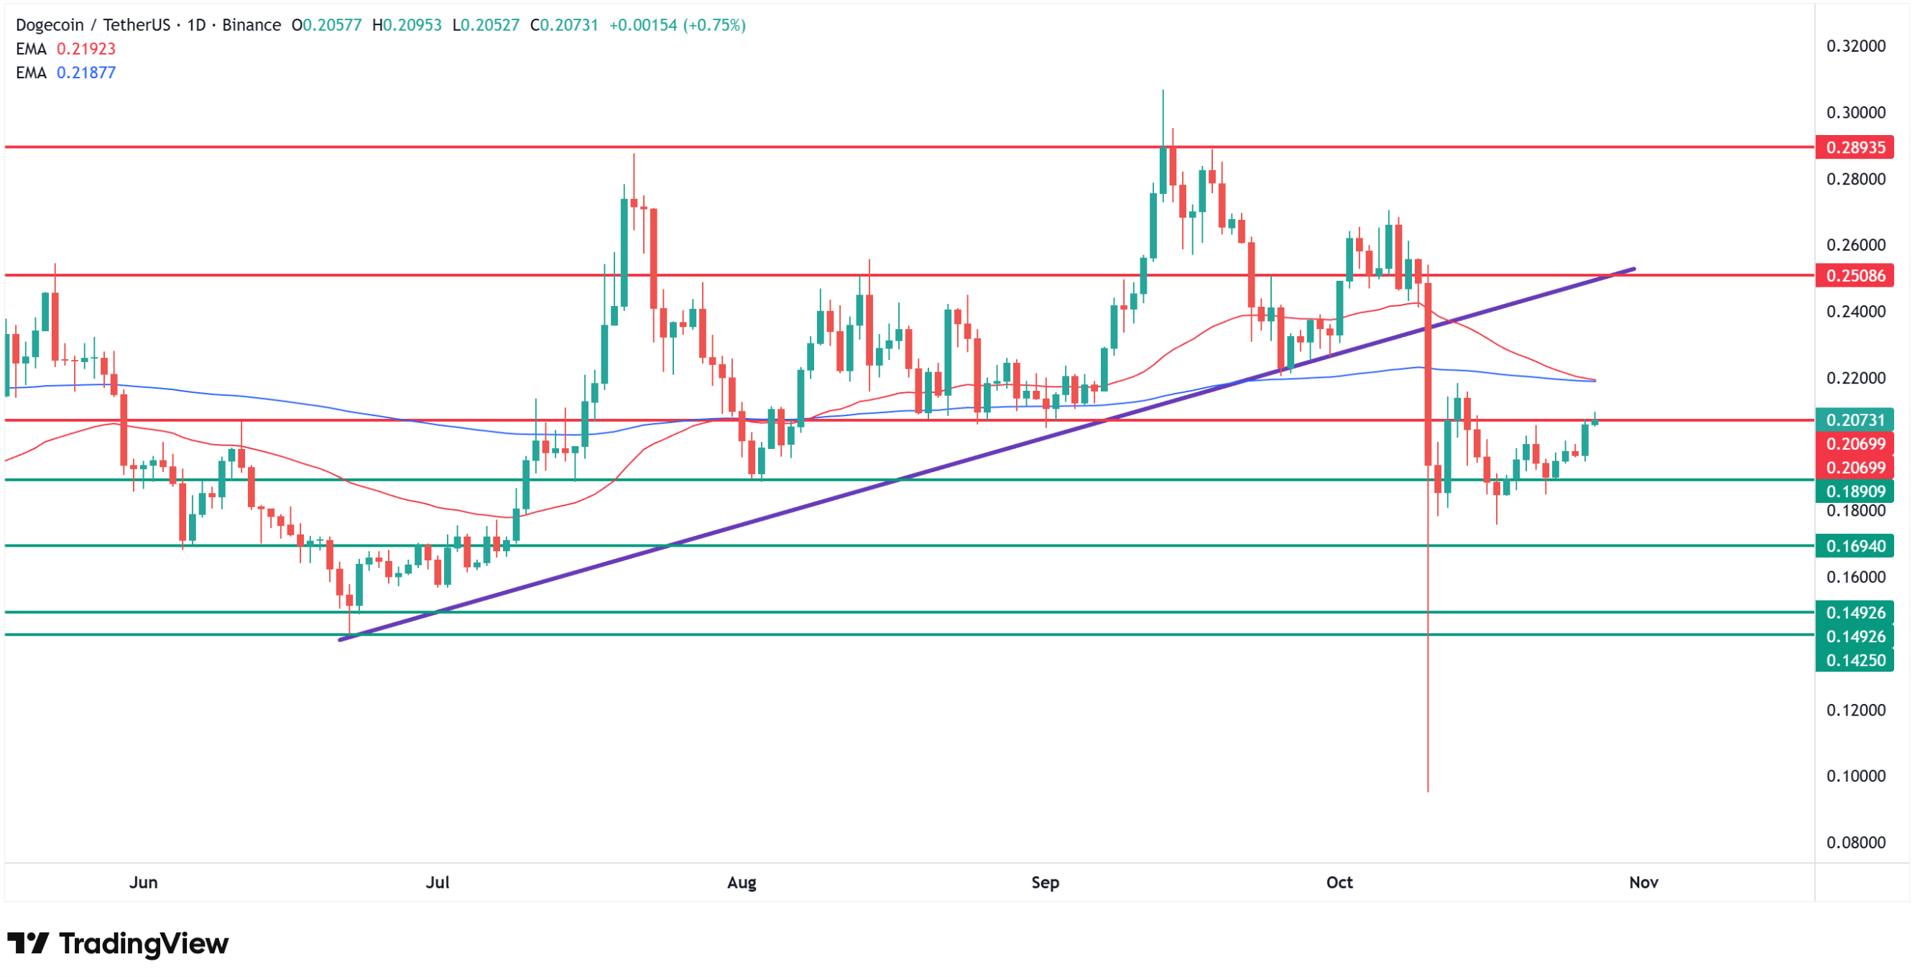
What would
need to happen for me to change my view on Dogecoin? First and foremost,
breaking the current resistance zone and the intraday moving average grid at
$0.22 would be necessary, which would open the path back toward highs toward
the next significant resistance level at $0.25.
Bitcoin Price Prediction: Seasonal
Trends Support Q4 Strength
Kruger
emphasized the importance of historical patterns supporting the current rally.
“We continue to emphasize the importance of seasonal trend analysis, which
remains relevant despite October’s uneven performance so far. Historically,
both October and the broader fourth quarter have delivered strong results for
bitcoin and crypto markets as a whole.”
While
October started with volatility, including the October 10 crash that wiped
billions from the crypto market, “there is still ample time for momentum
to shift—and as we know, a week can be a long time in crypto,” Kruger
noted. The five-day winning streak demonstrates how quickly sentiment can
reverse when catalysts align, particularly with the combination of improving
trade relations, dovish Fed expectations, and technical breakouts converging
simultaneously.
Bitcoin’s
potential targets based on technical projections include $134,100 according
to falling wedge breakout analysis, with critical resistance at $117,600
needing to hold on a daily close basis. A full breakout above that level would
unlock subsequent resistance at $121,400 and $126,300, potentially establishing
new all-time highs before year-end.
Crypto Price Analysis, FAQ
Why is crypto surging for
5 days straight?
Cryptocurrency
markets rallied for five consecutive sessions driven by US-China trade
framework agreement announced October 26 (preventing threatened 100% tariffs),
Federal Reserve rate cut expectations at 98.3% probability for October 29
meeting following weaker-than-expected 3% CPI data, technical breakouts with
Bitcoin reclaiming $114,176 50-day MA and Ethereum surging past $4,200, and
$319.18 million short liquidations creating squeeze dynamics.
Will Bitcoin continue
going up?
Bitcoin
trades at $115,956 after breaking 50-day MA, with technical analysis targeting
$120,000 retest (July highs) then $123,000-$126,000 (all-time high zones),
though LMAX strategist Joel Kruger notes “recent pullback appears to be
healthy consolidation” with markets “well supported on dips, paving
the way for another leg higher into year-end” supported by seasonal Q4
strength historically delivering strong crypto performance.
What’s causing the Ethereum
rally?
Key
catalysts include US Treasury Secretary Scott Bessent announcing “very
substantial framework” with China preventing tariff escalation, September
CPI falling to 3% below 3.1% expected reinforcing Fed dovish stance, softer
yields creating attractive environment for non-yielding assets, technical
breakouts above key moving averages, and structural tailwinds from
institutional adoption and regulatory clarity throughout 2025’s “defining
year for digital assets”.
Is it too late to buy
crypto now?
No. Bitcoin
recovered nearly half of October 10 crash losses but remains 8% below $126,198
all-time high, with analysts targeting $134,100 potential on falling wedge
breakout though critical resistance at $117,600 requires daily close
confirmation, while Kruger cautions markets should be “well supported on
dips” suggesting pullbacks offer entry opportunities, though
cryptocurrency volatility requires careful position sizing and risk management
given rapid five-day advance.
Cryptocurrency
markets extended their winning streak for a fifth consecutive session today
(Monday), 27 October 20205, as Bitcoin price surged past $115,000 and Ethereum
reclaimed the critical $4,200 level, with the rally fueled by easing US-China
trade tensions and growing expectations for Federal Reserve rate cuts.
In this
article, I analyze four charts – BTC/USDT, ETH/USDT, XRP/USDT and DOGE/USDT –
drawing on more than 10 years of experience as an investor and technical
analyst to explore why cryptocurrency prices are surging.
Total
cryptocurrency market capitalization climbed approximately 1.9% to $3.92
trillion as investors positioned ahead of the Fed’s October 29 meeting, where
there’s a 98.3% probability of a 25-basis-point rate cut according to
CME’s FedWatch Tool.
|
5-Day Crypto Rally Performance |
Oct 22 Start |
Oct 27 Current |
Gain % |
Key Level Broken |
|
Bitcoin (BTC) |
$111,032 |
$115,956 |
+4.4% |
$114,176 (50-day MA) |
|
Ethereum (ETH) |
$3,950 |
$4,253 |
+7.7% |
$4,070 (August lows) |
|
Total Market Cap |
$3.85T |
$3.92T |
+1.9% |
— |
|
Short Liquidations |
— |
$319M |
— |
24-hour cascade |
Bitcoin
traded at $115,956 at 8:17 AM CET Monday, gaining 1.22% daily after Sunday’s
2.6% surge that broke through the 50-day exponential moving average at
$114,176. The cryptocurrency has now recovered nearly half of the losses from
the October 10 crash that sent prices tumbling to $103,000, demonstrating
remarkable resilience as bulls target a retest of the $120,000 level.
US-China Trade Framework
Sparks Weekend Rally
The
cryptocurrency surge accelerated over the weekend following the announcement of
a US-China trade framework agreement reached during two days of negotiations in
Malaysia on October 26. US Treasury Secretary Scott Bessent stated that
negotiators achieved a “very substantial framework” that could
prevent threatened 100% US tariffs and secure a pause on China’s rare-earth
export restrictions.
Joel
Kruger, strategist at LMAX, emphasized that “the recent rebound in crypto
has been supported by an improving macro backdrop—particularly softer U.S. CPI
data that has reinforced expectations for Federal Reserve rate cuts and a more
accommodative policy stance.” He added that “together with easing
yields and stronger risk sentiment, this has provided a catalyst for renewed
demand across digital assets heading into year-end.”
I also invite you to check my previous Bitcoin, crypto and metals analyses:
Bitcoin Technical Breakout
Opens Path to $120K
According
to my technical analysis, Bitcoin (BTC) price is climbing for a fifth
consecutive session, with Sunday’s 2.6% gain breaking through the 50-day
exponential moving average at $114,176. Monday’s additional 1% advance
establishes two-week highs at $115,647, with the cryptocurrency reclaiming the
23.6% Fibonacci retracement and opening the path toward a retest of the
psychologically significant $120,000 level marked by July highs.
Breaking
through this $120,000 zone would open the door toward $123,000 and subsequently
$126,000, representing the all-time highs established on August 1 and October 5,
respectively. Although Bitcoin experienced turbulence in early October,
including a single-day 7% decline, the cryptocurrency found support at the
200-day exponential moving average (200 EMA) at $108,639, with a double-bottom
formation providing the platform for the current decisive bounce and return to
upward momentum.
In my view,
Bitcoin could return to price discovery mode before year-end, establishing new
all-time highs and climbing further north.
Derivatives
data from CoinGlass showed $319.18 million in short liquidations over
24 hours through Sunday, indicating bearish positions were squeezed as the
breakout accelerated. Trading volume jumped approximately 318% above session
average during the initial surge past $112,000, confirming genuine buying
interest rather than thin liquidity driving the move.
You may also like: This Trading Giant Who Called Bitcoin’s 2025 Peak Just Made Another Bold 420% Price Prediction
Ethereum Surges Past
$4,200 After Testing 200 EMA
From my
technical analysis of the Ethereum (ETH) price chart, the cryptocurrency is
rising for a fifth straight session, and after a very strong Sunday surge of
over 5%, it added another 2% Monday, testing intraday levels at $4,253. Most
significantly, Ethereum broke above the 50-day exponential moving average (50
EMA) for the first time in over two weeks, returning above the psychologically
important $4,000 level and the resistance marked by mid-August lows.
As a
result, Ethereum now has room to bounce toward this year’s highs drawn around
the $4,800 level, established by August highs and subsequently tested four more
times. A stronger base for Ethereum ‘s rebound was provided by testing the
200-day exponential moving average (200 EMA) and 50% Fibonacci retracement from
the first part of the month, along with local support in the form of a double
bottom drawn in recent weeks around $3,700.
Kruger
noted that “from a technical standpoint, the outlook remains constructive.
The recent pullback in bitcoin and ether appears to be a healthy consolidation
phase following fresh record highs against the U.S. dollar.” He expects
“these markets to remain well supported on dips, paving the way for
another leg higher into year-end.”
XRP Consolidates Below Key
Resistance Despite Rally
Although
XRP is rising for a fifth consecutive session just like Ethereum and Bitcoin ,
according to my technical analysis the chart sits in a somewhat worse position
following strong 15% declines from early October that broke a wedge formation
and entered consolidation at levels last tested in July. Support was
established in the $2.20-$2.35 range, while resistance sits in the $2.60-$2.70
zone, additionally strengthened by the 50 EMA and 200 EMA.
Until XRP
breaks through this resistance zone, in my view, the price remains under
pressure and could decline again to $2.35, or even further toward June lows
around the psychologically round $2.00 level. The cryptocurrency needs to
reclaim the moving average grid and push decisively above $2.70 to invalidate the
bearish technical setup and open the path toward higher targets.
XRP price prediction: This XRP Price Prediction From Ex-Goldman Analyst Eyes $1,000 by 2030
Dogecoin Faces Death Cross
Warning
Dogecoin
(DOGE) price, unlike the cryptocurrencies described above, is not rising for a
fifth consecutive session. However, it gained nearly 5% Sunday and added
another 1% Monday, establishing session highs at $0.2095. This doesn’t change
the fact that price continues consolidating at August levels below an important
resistance zone marked by lows also from that month around $0.21.
It’s worth
emphasizing that the 50-day moving average has practically crossed below the
200 EMA from above, which for technical analysis enthusiasts like myself
represents a very strong signal that could push Dogecoin’s price significantly
lower from current levels. My target downside level would be around
$0.14—representing June 20 lows this year and marking the beginning of the
current cycle for Dogecoin, which extends up to peaks tested in September
around $0.30.
What would
need to happen for me to change my view on Dogecoin? First and foremost,
breaking the current resistance zone and the intraday moving average grid at
$0.22 would be necessary, which would open the path back toward highs toward
the next significant resistance level at $0.25.
Bitcoin Price Prediction: Seasonal
Trends Support Q4 Strength
Kruger
emphasized the importance of historical patterns supporting the current rally.
“We continue to emphasize the importance of seasonal trend analysis, which
remains relevant despite October’s uneven performance so far. Historically,
both October and the broader fourth quarter have delivered strong results for
bitcoin and crypto markets as a whole.”
While
October started with volatility, including the October 10 crash that wiped
billions from the crypto market, “there is still ample time for momentum
to shift—and as we know, a week can be a long time in crypto,” Kruger
noted. The five-day winning streak demonstrates how quickly sentiment can
reverse when catalysts align, particularly with the combination of improving
trade relations, dovish Fed expectations, and technical breakouts converging
simultaneously.
Bitcoin’s
potential targets based on technical projections include $134,100 according
to falling wedge breakout analysis, with critical resistance at $117,600
needing to hold on a daily close basis. A full breakout above that level would
unlock subsequent resistance at $121,400 and $126,300, potentially establishing
new all-time highs before year-end.
Crypto Price Analysis, FAQ
Why is crypto surging for
5 days straight?
Cryptocurrency
markets rallied for five consecutive sessions driven by US-China trade
framework agreement announced October 26 (preventing threatened 100% tariffs),
Federal Reserve rate cut expectations at 98.3% probability for October 29
meeting following weaker-than-expected 3% CPI data, technical breakouts with
Bitcoin reclaiming $114,176 50-day MA and Ethereum surging past $4,200, and
$319.18 million short liquidations creating squeeze dynamics.
Will Bitcoin continue
going up?
Bitcoin
trades at $115,956 after breaking 50-day MA, with technical analysis targeting
$120,000 retest (July highs) then $123,000-$126,000 (all-time high zones),
though LMAX strategist Joel Kruger notes “recent pullback appears to be
healthy consolidation” with markets “well supported on dips, paving
the way for another leg higher into year-end” supported by seasonal Q4
strength historically delivering strong crypto performance.
What’s causing the Ethereum
rally?
Key
catalysts include US Treasury Secretary Scott Bessent announcing “very
substantial framework” with China preventing tariff escalation, September
CPI falling to 3% below 3.1% expected reinforcing Fed dovish stance, softer
yields creating attractive environment for non-yielding assets, technical
breakouts above key moving averages, and structural tailwinds from
institutional adoption and regulatory clarity throughout 2025’s “defining
year for digital assets”.
Is it too late to buy
crypto now?
No. Bitcoin
recovered nearly half of October 10 crash losses but remains 8% below $126,198
all-time high, with analysts targeting $134,100 potential on falling wedge
breakout though critical resistance at $117,600 requires daily close
confirmation, while Kruger cautions markets should be “well supported on
dips” suggesting pullbacks offer entry opportunities, though
cryptocurrency volatility requires careful position sizing and risk management
given rapid five-day advance.
Search
RECENT PRESS RELEASES
HICL Infrastructure stock rises on A63 disposal
SWI Editorial Staff2026-03-25T01:48:09-07:00March 25, 2026|
Grab Sony headphones and earbuds for less during Amazon’s Spring Sale
SWI Editorial Staff2026-03-25T01:45:00-07:00March 25, 2026|
Zelestra secures $600m Texas solar financing
SWI Editorial Staff2026-03-25T01:42:04-07:00March 25, 2026|
[Analysis] “Ethereum staking ratio hits record high…rising odds of a ‘supply shock'”
SWI Editorial Staff2026-03-25T01:29:44-07:00March 25, 2026|
Guy Katsovich joins Mor-Langerman Capital as Director of IPOs and capital raising for tec
SWI Editorial Staff2026-03-25T01:25:51-07:00March 25, 2026|
Rohrman’s Jeremy Nowling on Amazon Autos: ‘What do you have to lose?’
SWI Editorial Staff2026-03-25T01:21:29-07:00March 25, 2026|
Related Post


