Why Gold Is Going Down? Metal Falls With Bitcoin 4th Day in a Row and Gold Price Predictio
October 30, 2025
Gold price extended
losses for a fourth consecutive session, trading today (Thursday), 30 October
2025, at $3,972.30 per ounce (-0.71%) after Federal Reserve (Fed) Chairman
Jerome Powell walked back market expectations for a December rate cut,
strengthening the dollar and pressuring precious metals.
The
extended selloff has pushed gold 8.9% below last Friday’s $4,144 level, with
the metal testing $3,915 on Wednesday before Thursday’s modest 0.8% rebound
failed to reclaim the psychologically critical $4,000 threshold.
The dollar
is strengthening, Bitcoin is also falling, and traders are asking why gold is
down today. In this article, I conduct technical analysis of the XAU/USD and
BTC/USDT charts to answer that question and review the latest gold price
predictions.
The Federal
Reserve’s rate cut Wednesday, while expected, came with hawkish commentary that
caught markets off guard. Peter Grant, VP and senior strategist at Zaner
Metals, noted: “Gold had a logical reaction to Powell trying to walk back
expectations for a December cut. We’re already seeing Fed funds futures
trimming expectations, that would be dollar positive and gold negative.”
The dollar
index surged to 99.36 following Powell’s comments, one of the highest levels
since August, as traders reduced bets on another rate cut in December.
Yesterday’s declines were mainly caused by dollar strengthening after the Fed’s
rate cut decision, which boosted the DXY index to this elevated level.
Chair Powell reads opening statement at the #FOMC press conference on October 29, 2025: https://t.co/ZDw8oqy6g3
— Federal Reserve (@federalreserve)
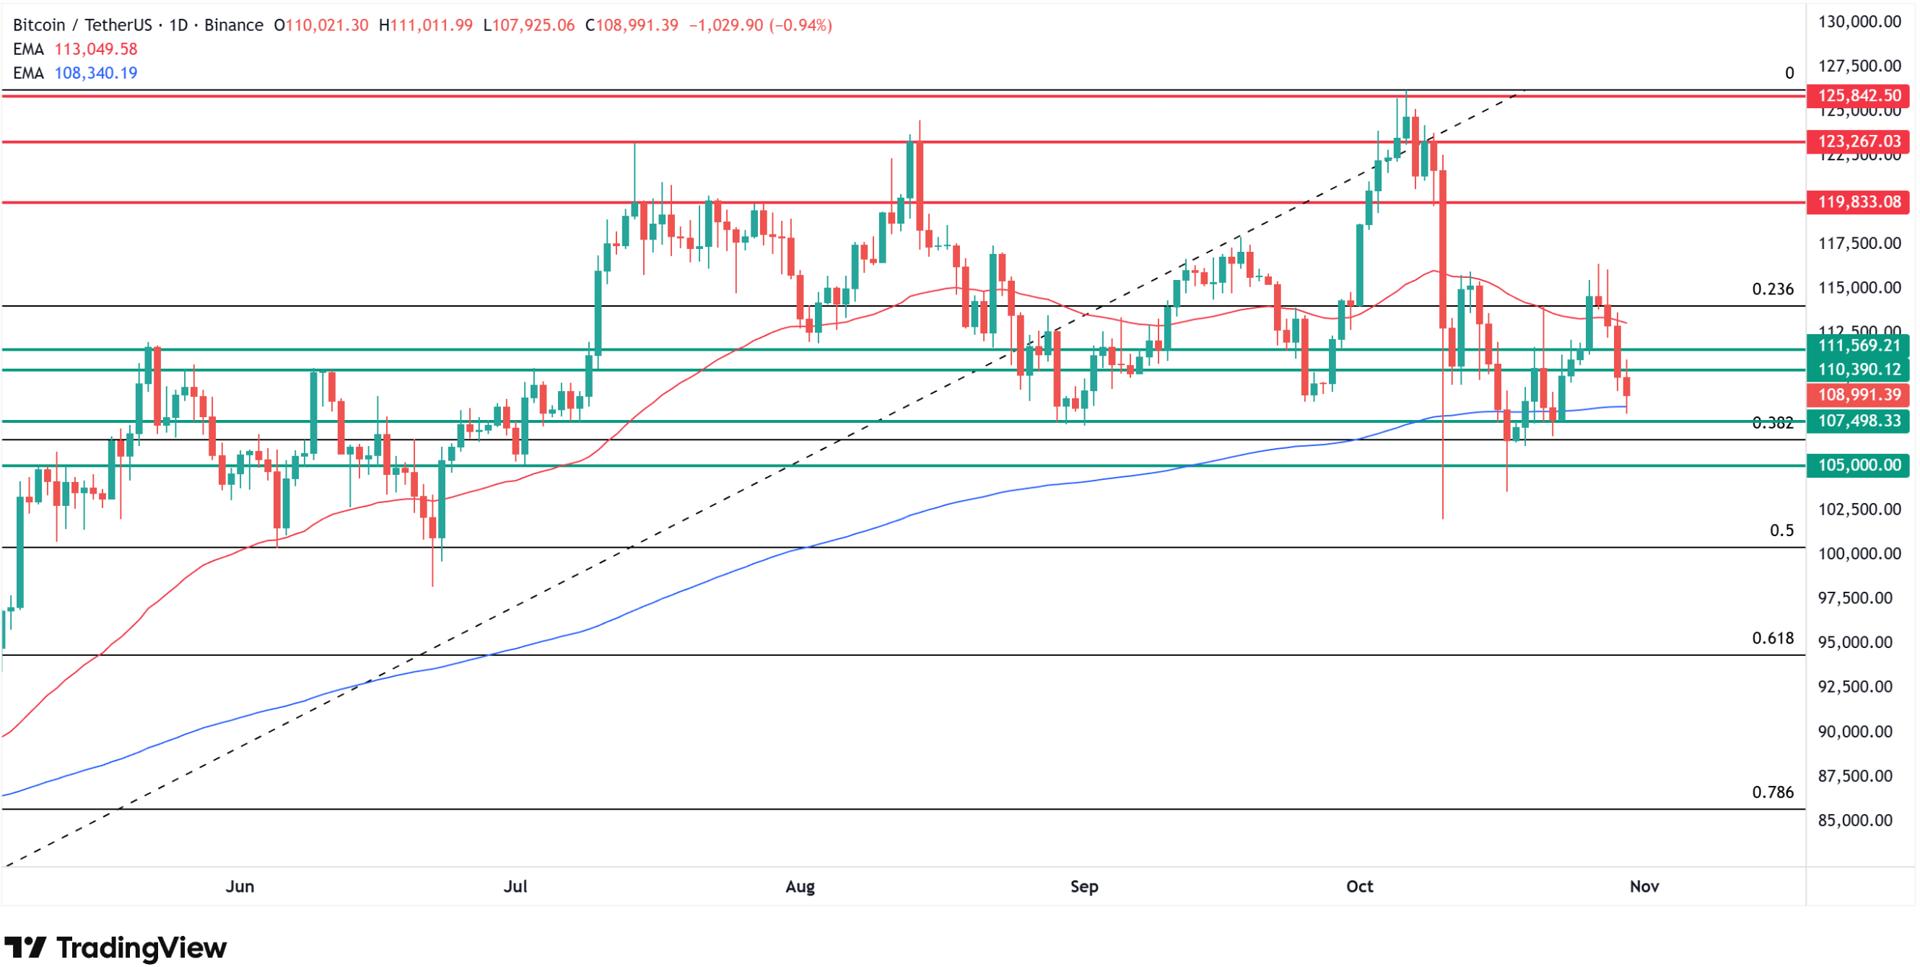
Together
with gold, Bitcoin is also falling for a fourth consecutive session, often
called “digital gold,” testing intraday lows below $108,000 Thursday.
As a result, BTC prices are again declining below the support zone around
$110,000 and stopping at the 200 EMA, combined with the 38.2% Fibonacci
retracement and a broad support zone marked by July and September lows also
tested in October (extending down to $105,000).
|
4-Day Decline Performance |
Oct 27-30, 2025 |
|
Gold Futures (GCUSD) |
$3,972.30 |
|
Daily Change |
-$28.40 (-0.71%) |
|
Friday Oct 24 Close |
$4,144.00 |
|
4-Day Total Decline |
-$171.70 (-4.14%) |
|
Session Range |
$3,925.10-$3,995.30 |
|
Volume |
64,749 (34x average) |
|
Bitcoin (BTC/USD) |
$108,000 (also 4th decline) |
Michał
Stajniak, analyst at XTB, also explained Wednesday’s catalyst: “The Fed
decided to cut interest rates by 25 basis points to the 3.75-4.00% range, in
line with market expectations. Powell indicated during the press conference
that the December decision is not certain, and opinions among FOMC members are
strongly divided. EUR/USD retreated below 1.1600 after this information.”
However, in
my view, the dollar will weaken in the longer perspective, which will also
translate into growth for both gold and Bitcoin. Nonetheless, in the short term
we can see some deepened correction.
Gold Price Analysis Shows
Bearish Pin Bar
According
to my technical analysis, gold prices have now experienced four consecutive
declining sessions, correcting significantly from the $4,144 level observed
last Friday to $3,915 noted yesterday. Although Thursday, October 30, 2025
brings a modest rebound of 0.8% and a test of the $3,982 level per ounce,
precious metal prices remain below the psychological $4,000 barrier.
Simultaneously,
as my technical analysis shows, Wednesday drew a bearish pin bar on the daily
chart under this psychological resistance, which generates a sell signal and
the possibility of a stronger correction toward the support zone between $3,275
and $3,441, which I wrote about in my earlier analysis in this place. This zone
is simultaneously strengthened by the 200 EMA, and from current levels gold
could decline by 17%, as
I mentioned in my previous gold analysis.
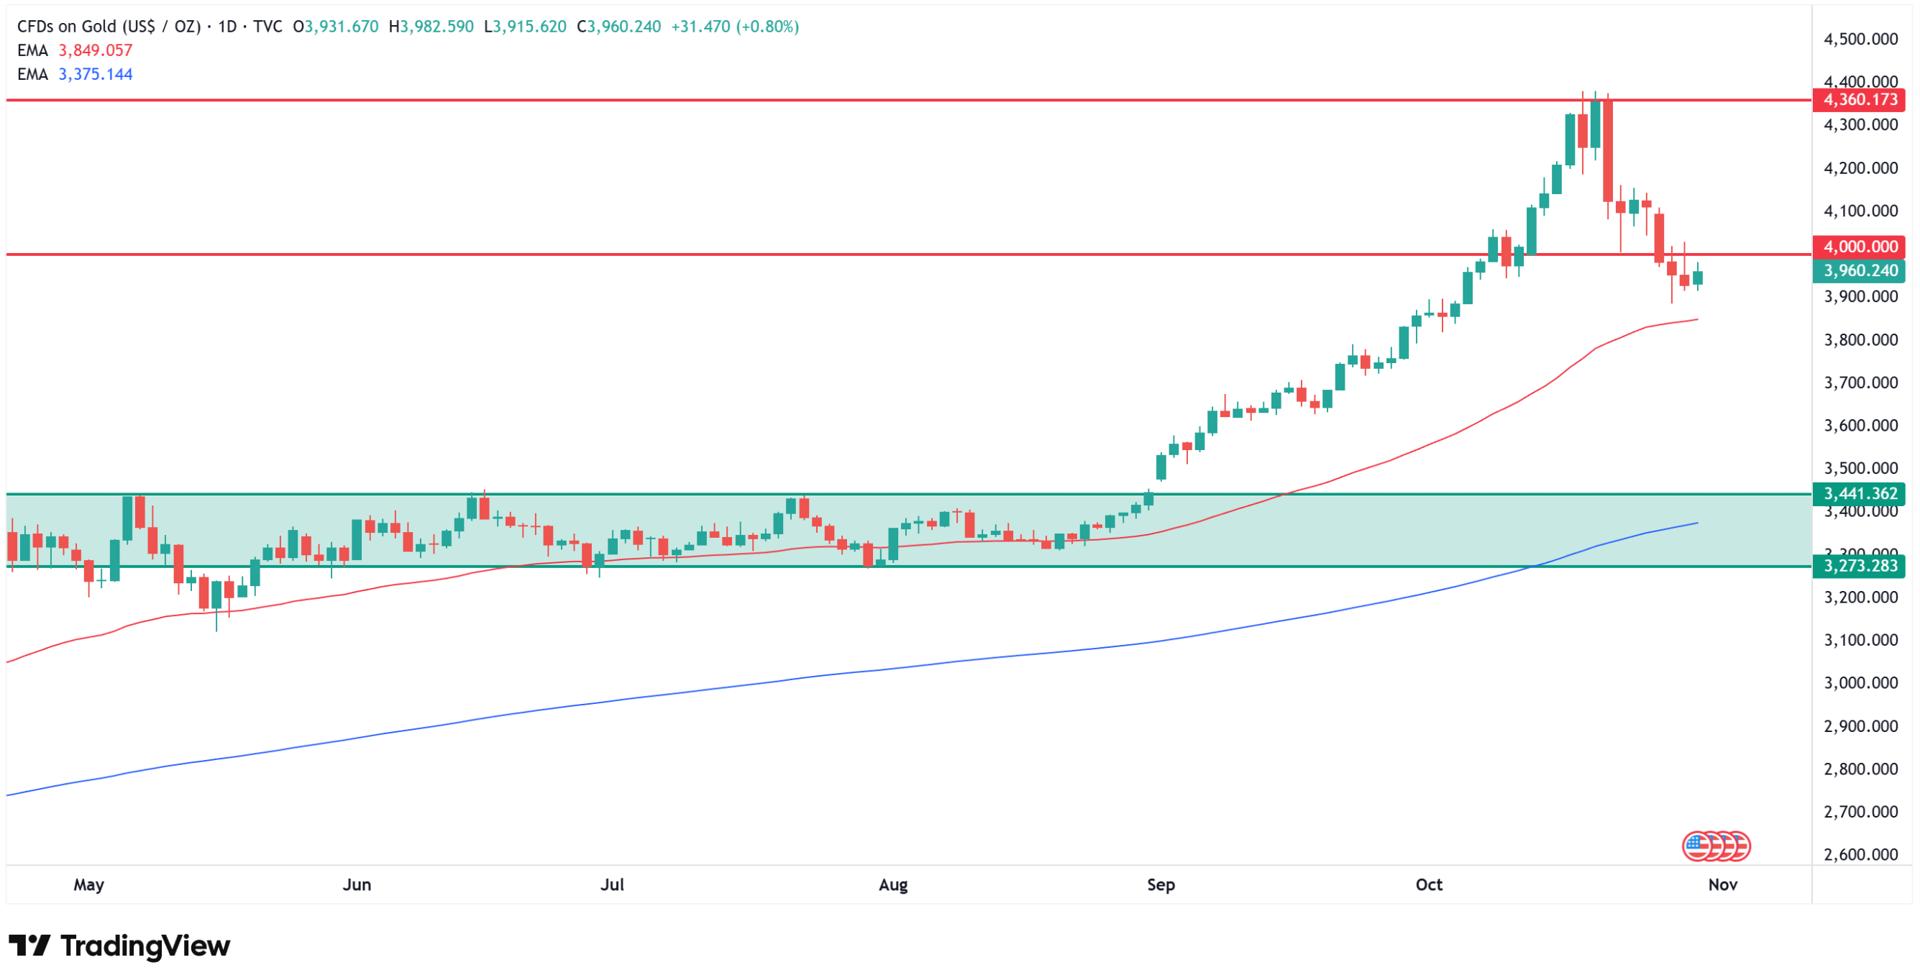
It’s true
that gold still has the 50 EMA ahead of it, above which it has moved
continuously since the beginning of 2025. Historically, however, this average
has not proven to be as strong support as the aforementioned 200-day indicator.
The 50-day moving average currently sits at $3,776.45, representing the first
major technical test if the current correction extends.
Bitcoin Correlation
Highlights Risk-Asset Weakness
Unlike
gold, on the BTC/USDT chart I would expect a chance for a rebound and, in the
medium term, a return to the vicinity of the ATH around $126,000, which would
certainly also help gold. For that matter, on gold, like analysts at major
banks, I also forecast a return to the price discovery phase in the medium
term.
The
parallel weakness in both gold and Bitcoin, each declining for four consecutive
sessions, highlights a broader risk-asset rotation rather than isolated
precious metal weakness. Bitcoin testing support below $110,000 and finding
buyers at the 200 EMA zone suggests digital assets face similar technical
pressure as traditional safe-havens.
Why am I
mentioning Bitcoin when talking about gold? Among other reasons, because in
recent days the two have been moving in tandem, a trend seen especially when
gold posted its sharpest one-day drop since 2020.
The
correlation between these assets typically strengthens during periods of dollar
strength, as witnessed following Powell’s hawkish Wednesday comments. Volume in
gold futures surged to 64,749 contracts, 34 times the average of 1,879, indicating
heavy institutional selling pressure and potential capitulation among leveraged
traders.
Gold Price Prediction: Long-Term
Institutional Forecasts Remain Bullish
Despite the
near-term bearish technical setup, major financial institutions maintain
aggressively bullish medium-term forecasts. JP Morgan projects gold averaging
$5,055 per ounce by Q4 2026, a 27% premium to current $3,972 levels, while Goldman
Sachs targets $4,900 by December 2026, representing 23% upside.
These
institutional forecasts provide important context for the current 4-day
decline. While technical indicators suggest potential for further near-term
weakness toward the $3,776 or even $3,275-$3,441 support zones, the strategic
outlook remains positive based on structural demand drivers that transcend
short-term Fed policy uncertainty or dollar strength.
Morgan
Stanley recently revised its 2026 forecast upward to $4,400 per ounce, while
Metals Focus sees gold reaching $5,000 in 2026 as uncertainty persists across
global markets. The convergence of these bullish institutional views, all
significantly above current spot prices, suggests sophisticated analysts view
the correction as a buying opportunity rather than the start of a prolonged
bear market.
Before you leave, please also check my previous analysis with Bitcoin and gold price predictions:
Gold Price Analysis, FAQ
Why is gold falling for 4
days straight?
Gold
declined fourth consecutive session to $3,972.30 (-0.71% Thursday, -4.14% from
Friday $4,144) triggered by Federal Reserve Chair Powell walking back December
rate cut expectations during Wednesday press conference, strengthening dollar
to 99.36 (highest since August), with Peter Grant (Zaner Metals) noting
“Powell trying to walk back expectations for December cut” proving
“dollar positive and gold negative,” while bearish pin bar formed
under $4,000 resistance generating technical sell signal.
Is gold crash over or will
it continue declining?
No. According
to my technical analysis, Wednesday’s bearish pin bar under $4,000
psychological resistance generates sell signal with potential 17% downside
toward $3,275-$3,441 support zone (200 EMA confluence), though 50 EMA at $3,776
represents first major test, with RSI remaining elevated suggesting correction
incomplete, but everything above 200 EMA maintains uptrend definition and JP
Morgan/Goldman Sachs forecasts $4,900-$5,055 by 2026 viewing weakness as buying
opportunity.
How low will gold prices
go in 2025?
My
technical analysis identifies first downside target at 50-day EMA $3,776.45 (5%
below current $3,972), with main support zone $3,275-$3,441 coinciding with
200-day EMA $3,316 representing 17% decline potential, though volume surge to
64,749 (34x average) suggests capitulation may be approaching, while long-term
forecasts remain bullish with Trading Economics $4,157 Q4 2025, Goldman Sachs
$4,900 Dec 2026, JP Morgan $5,055 Q4 2026.
Why are Bitcoin and gold
both falling?
Bitcoin
declined fourth consecutive session testing below $108,000 alongside gold’s
parallel weakness, with both assets pressured by dollar strength (DXY 99.36
after Powell’s hawkish comments) indicating broad risk-asset rotation, though
my analysis expects Bitcoin chance for rebound toward $126,000 ATH in medium
term which would help gold, as longer perspective dollar weakness from Fed
easing bias and fiscal deficits will translate into growth for both gold and
Bitcoin.
Gold price extended
losses for a fourth consecutive session, trading today (Thursday), 30 October
2025, at $3,972.30 per ounce (-0.71%) after Federal Reserve (Fed) Chairman
Jerome Powell walked back market expectations for a December rate cut,
strengthening the dollar and pressuring precious metals.
The
extended selloff has pushed gold 8.9% below last Friday’s $4,144 level, with
the metal testing $3,915 on Wednesday before Thursday’s modest 0.8% rebound
failed to reclaim the psychologically critical $4,000 threshold.
The dollar
is strengthening, Bitcoin is also falling, and traders are asking why gold is
down today. In this article, I conduct technical analysis of the XAU/USD and
BTC/USDT charts to answer that question and review the latest gold price
predictions.
The Federal
Reserve’s rate cut Wednesday, while expected, came with hawkish commentary that
caught markets off guard. Peter Grant, VP and senior strategist at Zaner
Metals, noted: “Gold had a logical reaction to Powell trying to walk back
expectations for a December cut. We’re already seeing Fed funds futures
trimming expectations, that would be dollar positive and gold negative.”
The dollar
index surged to 99.36 following Powell’s comments, one of the highest levels
since August, as traders reduced bets on another rate cut in December.
Yesterday’s declines were mainly caused by dollar strengthening after the Fed’s
rate cut decision, which boosted the DXY index to this elevated level.
Chair Powell reads opening statement at the #FOMC press conference on October 29, 2025: https://t.co/ZDw8oqy6g3
— Federal Reserve (@federalreserve)
Together
with gold, Bitcoin is also falling for a fourth consecutive session, often
called “digital gold,” testing intraday lows below $108,000 Thursday.
As a result, BTC prices are again declining below the support zone around
$110,000 and stopping at the 200 EMA, combined with the 38.2% Fibonacci
retracement and a broad support zone marked by July and September lows also
tested in October (extending down to $105,000).
|
4-Day Decline Performance |
Oct 27-30, 2025 |
|
Gold Futures (GCUSD) |
$3,972.30 |
|
Daily Change |
-$28.40 (-0.71%) |
|
Friday Oct 24 Close |
$4,144.00 |
|
4-Day Total Decline |
-$171.70 (-4.14%) |
|
Session Range |
$3,925.10-$3,995.30 |
|
Volume |
64,749 (34x average) |
|
Bitcoin (BTC/USD) |
$108,000 (also 4th decline) |
Michał
Stajniak, analyst at XTB, also explained Wednesday’s catalyst: “The Fed
decided to cut interest rates by 25 basis points to the 3.75-4.00% range, in
line with market expectations. Powell indicated during the press conference
that the December decision is not certain, and opinions among FOMC members are
strongly divided. EUR/USD retreated below 1.1600 after this information.”
However, in
my view, the dollar will weaken in the longer perspective, which will also
translate into growth for both gold and Bitcoin. Nonetheless, in the short term
we can see some deepened correction.
Gold Price Analysis Shows
Bearish Pin Bar
According
to my technical analysis, gold prices have now experienced four consecutive
declining sessions, correcting significantly from the $4,144 level observed
last Friday to $3,915 noted yesterday. Although Thursday, October 30, 2025
brings a modest rebound of 0.8% and a test of the $3,982 level per ounce,
precious metal prices remain below the psychological $4,000 barrier.
Simultaneously,
as my technical analysis shows, Wednesday drew a bearish pin bar on the daily
chart under this psychological resistance, which generates a sell signal and
the possibility of a stronger correction toward the support zone between $3,275
and $3,441, which I wrote about in my earlier analysis in this place. This zone
is simultaneously strengthened by the 200 EMA, and from current levels gold
could decline by 17%, as
I mentioned in my previous gold analysis.
It’s true
that gold still has the 50 EMA ahead of it, above which it has moved
continuously since the beginning of 2025. Historically, however, this average
has not proven to be as strong support as the aforementioned 200-day indicator.
The 50-day moving average currently sits at $3,776.45, representing the first
major technical test if the current correction extends.
Bitcoin Correlation
Highlights Risk-Asset Weakness
Unlike
gold, on the BTC/USDT chart I would expect a chance for a rebound and, in the
medium term, a return to the vicinity of the ATH around $126,000, which would
certainly also help gold. For that matter, on gold, like analysts at major
banks, I also forecast a return to the price discovery phase in the medium
term.
The
parallel weakness in both gold and Bitcoin, each declining for four consecutive
sessions, highlights a broader risk-asset rotation rather than isolated
precious metal weakness. Bitcoin testing support below $110,000 and finding
buyers at the 200 EMA zone suggests digital assets face similar technical
pressure as traditional safe-havens.
Why am I
mentioning Bitcoin when talking about gold? Among other reasons, because in
recent days the two have been moving in tandem, a trend seen especially when
gold posted its sharpest one-day drop since 2020.
The
correlation between these assets typically strengthens during periods of dollar
strength, as witnessed following Powell’s hawkish Wednesday comments. Volume in
gold futures surged to 64,749 contracts, 34 times the average of 1,879, indicating
heavy institutional selling pressure and potential capitulation among leveraged
traders.
Gold Price Prediction: Long-Term
Institutional Forecasts Remain Bullish
Despite the
near-term bearish technical setup, major financial institutions maintain
aggressively bullish medium-term forecasts. JP Morgan projects gold averaging
$5,055 per ounce by Q4 2026, a 27% premium to current $3,972 levels, while Goldman
Sachs targets $4,900 by December 2026, representing 23% upside.
These
institutional forecasts provide important context for the current 4-day
decline. While technical indicators suggest potential for further near-term
weakness toward the $3,776 or even $3,275-$3,441 support zones, the strategic
outlook remains positive based on structural demand drivers that transcend
short-term Fed policy uncertainty or dollar strength.
Morgan
Stanley recently revised its 2026 forecast upward to $4,400 per ounce, while
Metals Focus sees gold reaching $5,000 in 2026 as uncertainty persists across
global markets. The convergence of these bullish institutional views, all
significantly above current spot prices, suggests sophisticated analysts view
the correction as a buying opportunity rather than the start of a prolonged
bear market.
Before you leave, please also check my previous analysis with Bitcoin and gold price predictions:
Gold Price Analysis, FAQ
Why is gold falling for 4
days straight?
Gold
declined fourth consecutive session to $3,972.30 (-0.71% Thursday, -4.14% from
Friday $4,144) triggered by Federal Reserve Chair Powell walking back December
rate cut expectations during Wednesday press conference, strengthening dollar
to 99.36 (highest since August), with Peter Grant (Zaner Metals) noting
“Powell trying to walk back expectations for December cut” proving
“dollar positive and gold negative,” while bearish pin bar formed
under $4,000 resistance generating technical sell signal.
Is gold crash over or will
it continue declining?
No. According
to my technical analysis, Wednesday’s bearish pin bar under $4,000
psychological resistance generates sell signal with potential 17% downside
toward $3,275-$3,441 support zone (200 EMA confluence), though 50 EMA at $3,776
represents first major test, with RSI remaining elevated suggesting correction
incomplete, but everything above 200 EMA maintains uptrend definition and JP
Morgan/Goldman Sachs forecasts $4,900-$5,055 by 2026 viewing weakness as buying
opportunity.
How low will gold prices
go in 2025?
My
technical analysis identifies first downside target at 50-day EMA $3,776.45 (5%
below current $3,972), with main support zone $3,275-$3,441 coinciding with
200-day EMA $3,316 representing 17% decline potential, though volume surge to
64,749 (34x average) suggests capitulation may be approaching, while long-term
forecasts remain bullish with Trading Economics $4,157 Q4 2025, Goldman Sachs
$4,900 Dec 2026, JP Morgan $5,055 Q4 2026.
Why are Bitcoin and gold
both falling?
Bitcoin
declined fourth consecutive session testing below $108,000 alongside gold’s
parallel weakness, with both assets pressured by dollar strength (DXY 99.36
after Powell’s hawkish comments) indicating broad risk-asset rotation, though
my analysis expects Bitcoin chance for rebound toward $126,000 ATH in medium
term which would help gold, as longer perspective dollar weakness from Fed
easing bias and fiscal deficits will translate into growth for both gold and
Bitcoin.
Search
RECENT PRESS RELEASES
Dow Jones Today: Stock Futures Point Lower After Trump-Xi Meeting, Powell Warning, Mixed B
SWI Editorial Staff2025-10-30T06:12:47-07:00October 30, 2025|
New Bitcoin Whales Control 45% of BTC Realized Cap — Here’s Why That’s a Problem
SWI Editorial Staff2025-10-30T06:11:49-07:00October 30, 2025|
France moves to create a national Bitcoin reserve
SWI Editorial Staff2025-10-30T06:11:20-07:00October 30, 2025|
Google strikes game-changing $3 billion deal with Bitcoin mining company: ‘One of the larg
SWI Editorial Staff2025-10-30T06:10:44-07:00October 30, 2025|
France moves to create a national Bitcoin reserve
SWI Editorial Staff2025-10-30T06:10:41-07:00October 30, 2025|
Bitcoin Crash To $87,600 Looms If This Support Snaps, Warns Veteran Analyst
SWI Editorial Staff2025-10-30T06:10:17-07:00October 30, 2025|
Related Post