Why is Bitcoin Cash (BCH) rallying?
March 5, 2025
- Bitcoin Cash’s price rallies more than 7% on Wednesday after retesting its key support the previous day.
- On-chain metrics paint a bullish picture as BCH’s transaction rate reaches a new high, and open interest is also rising.
- The technical outlook suggests a rally ahead, targeting the $390.5 level.
Bitcoin Cash (BCH) price is rallying more than 7%, trading around $342 on Wednesday after retesting its key support level the previous day. On-chain metrics support the bullish outlook as BCH’s transaction rate reaches a new high, and open interest is also rising. Moreover, the technical outlook suggests a rally ahead, targeting the $390.5 level.
Data from Bitcoin Cash Explorer projects a bullish outlook for BCH. The data shows that the transaction rate reached a new all-time high of 3.6 on Wednesday, indicating a recent surge in traders’ interest and liquidity and signaling greater blockchain usage in the BCH chain.
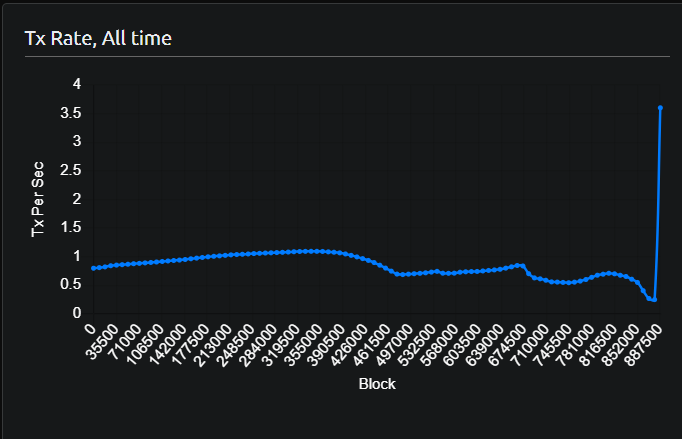
BCH Tx rate chart. Source: Bitcoin Cash Explorer
Bitcoin Cash’s Open Interest (OI) further supports the bullish outlook. Coinglass’s data shows that the futures’ OI in BCH at exchanges rose from $174.48 million on Sunday to $238.48 million on Wednesday, the highest level since early February. An increasing OI represents new or additional money entering the market and new buying, which suggests a rally ahead in the BCH price.
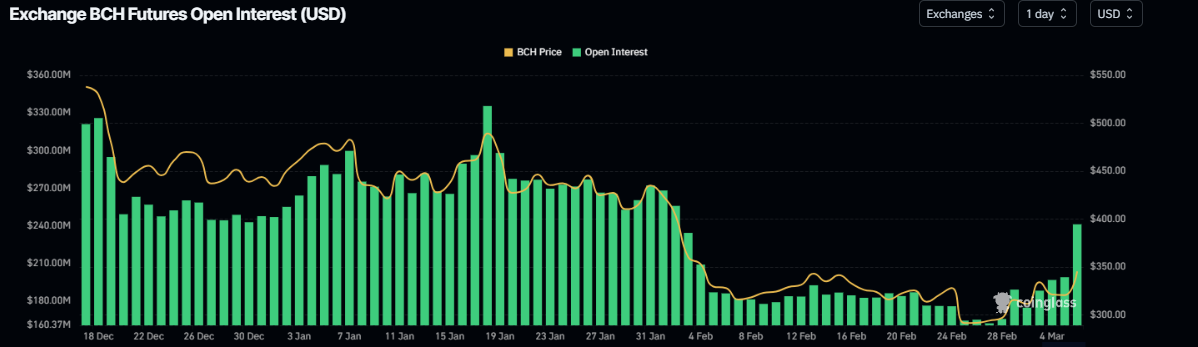
BCH open interest chart. Source: Coinglass
Bitcoin Cash price found support around its key range between $279.2 and $299.7 last week. Moreover, on Tuesday, it retested and bounced off from the support range and closed at $320.5. At the time of writing on Wednesday, it rallied by 7%, trading at around $342.4.
If the support range is maintained, BCH will extend the rally by nearly 13% from its current levels to retest its next resistance at $390.5.
The Relative Strength Index (RSI) on the daily chart reads 55, above its neutral level of 50 and points upwards, indicating bullish momentum. Moreover, the Moving Average Convergence Divergence (MACD) also showed a bulled crossover last week, suggesting an upward trend.
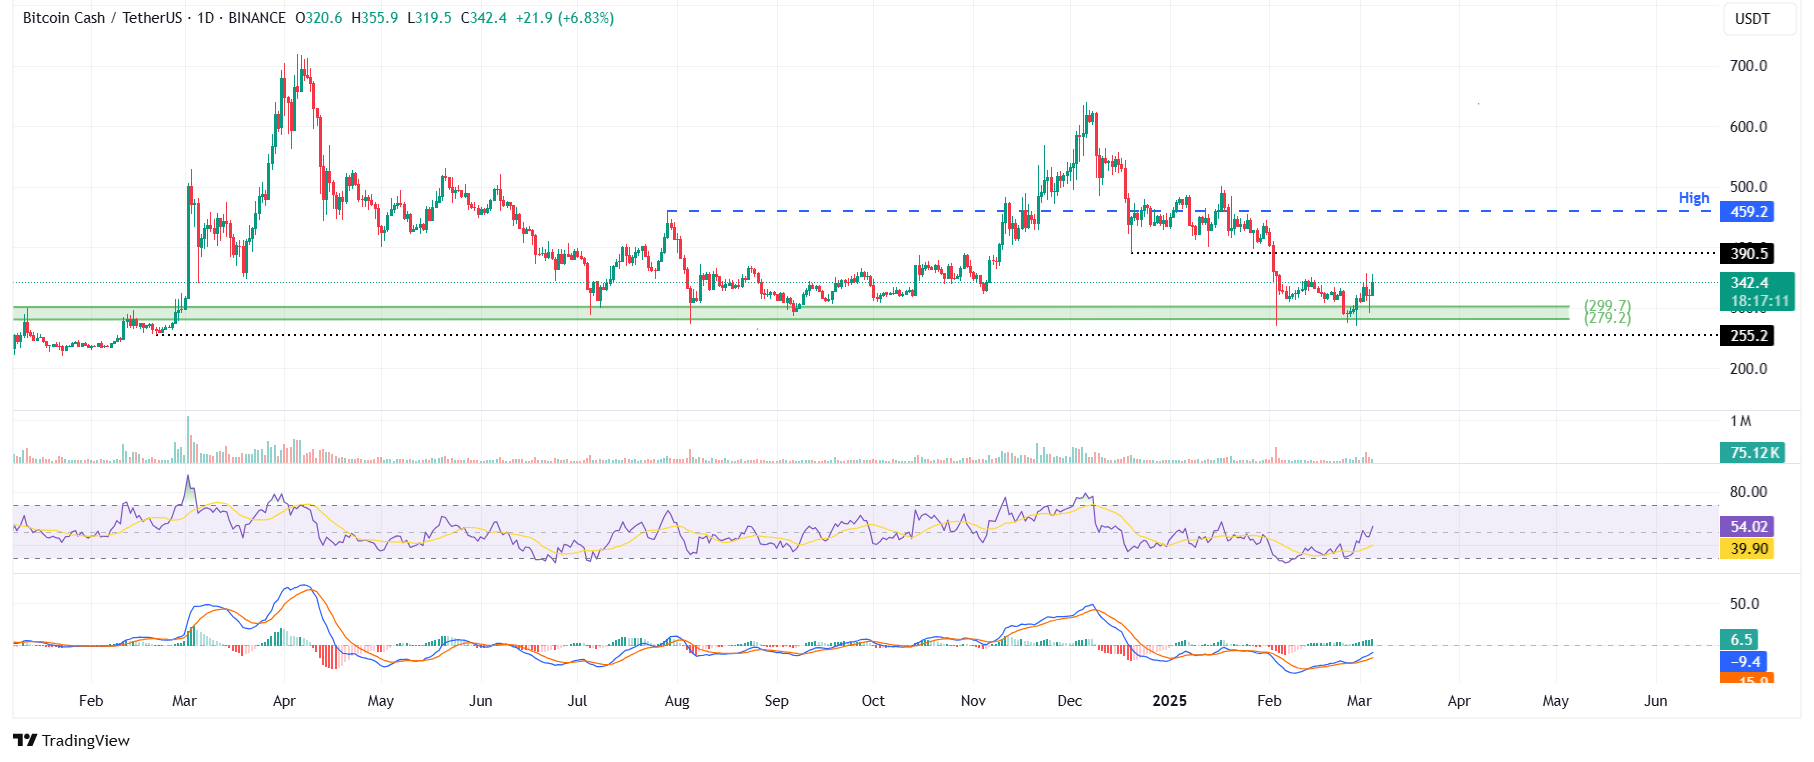
BCH/USDT daily chart
However, if BCH closes below the lower support range of $279.2, it could extend the decline February 21, 2024, low of $255.2.
Share:
Cryptos feed
Information on these pages contains forward-looking statements that involve risks and uncertainties. Markets and instruments profiled on this page are for informational purposes only and should not in any way come across as a recommendation to buy or sell in these assets. You should do your own thorough research before making any investment decisions. FXStreet does not in any way guarantee that this information is free from mistakes, errors, or material misstatements. It also does not guarantee that this information is of a timely nature. Investing in Open Markets involves a great deal of risk, including the loss of all or a portion of your investment, as well as emotional distress. All risks, losses and costs associated with investing, including total loss of principal, are your responsibility. The views and opinions expressed in this article are those of the authors and do not necessarily reflect the official policy or position of FXStreet nor its advertisers. The author will not be held responsible for information that is found at the end of links posted on this page.
If not otherwise explicitly mentioned in the body of the article, at the time of writing, the author has no position in any stock mentioned in this article and no business relationship with any company mentioned. The author has not received compensation for writing this article, other than from FXStreet.
FXStreet and the author do not provide personalized recommendations. The author makes no representations as to the accuracy, completeness, or suitability of this information. FXStreet and the author will not be liable for any errors, omissions or any losses, injuries or damages arising from this information and its display or use. Errors and omissions excepted.
The author and FXStreet are not registered investment advisors and nothing in this article is intended to be investment advice.
Search
RECENT PRESS RELEASES
Related Post


