Why Is Bitcoin Surging Today? BTC Price Tops $80,000 for Three-Month High as Iran De-escalation Lifts Crypto
May 3, 2026
Bitcoin (BTC) is surging at
$79,810 on Monday, May 4, 2026, after touching $80,393 in early Singapore
hours, the cryptocurrency’s highest print since Jan. 31, 2026. The move pushed
BTC above the $80,000 psychological level for the first time in three months
and reclaimed the bull market support band that had capped every recovery
attempt since November 2025.
Asian
equity benchmarks neared record highs in the same session, and Ether traded
higher in sympathy.
The rally
followed President Donald Trump’s announcement that the United States had
responded to Iran’s 14-point peace proposal and would begin escorting
commercial vessels through the Strait of Hormuz, sending U.S. crude futures
lower by nearly 5% and easing the macro headwind that had weighed on risk
assets through the first quarter.
Follow
me on X for real-time Bitcoin analysis: @ChmielDk
Iran De-escalation, Oil
Drop, and the $80K Psychological Break
The
catalyst stack is geopolitical first, technical second. Brent crude fell to
$107 per barrel from a four-year high after Iran sent its updated proposal to
mediators in Pakistan on May 1, and the U.S. response signaled a path away from
a full Strait of Hormuz closure that had kept oil-linked inflation expectations
elevated for two months. Risk assets reopened the conversation about Federal
Reserve policy as soon as the oil tape moved.
“Markets
are consolidating in a cautious tone as Middle East tensions drive oil-linked
inflation risks, keeping the US Dollar supported and central bank expectations
tilted hawkish while limiting conviction across risk assets,” said Joel
Kruger, Market Analyst at LMAX Group.
Kruger’s
read frames the move as a relief rally rather than a decisive trend break, with
the dollar trajectory still the gating variable for risk assets.
The same
dynamic played out in the FinanceMagnates.com April analysis on the Iran ceasefire
and short squeeze setup, which tracked $471 million in single-day spot ETF inflows on April 6
and a $427 million short squeeze as the precursor conditions to the $80,000
test now unfolding. Three further drivers compound the move:
- Trump-Iran de-escalation: U.S. crude futures fell
roughly 5%, with Brent at $107 from a four-year high near $130 - Strait of Hormuz commercial
escort:
removes the immediate tail-risk premium on oil and dollar - Bull market support band
reclaim: first
BTC close above the band in six months - CME gap fill thesis: $79K-$84K gap pulls price
toward the upper consolidation band - Average ETF cost basis at $83K: mechanical magnet if the
breakout holds
Bitcoin ETF Flows and
On-Chain Signals: The Institutional Bid Underneath
Spot
Bitcoin ETF demand explains the timing of the breakout. April closed with $2.44
billion in net inflows, the strongest institutional month since October 2025,
while May-to-date net inflows have already cleared $629 million per fund-level
tracking.
Cumulative
net inflows since the January 2024 launch stand at $58.5 billion, with
BlackRock’s IBIT holding roughly 812,000 BTC and commanding 62% market share.
Morgan Stanley’s MSBT, which launched April 8, drew over $100 million in its
first six trading days.
The
on-chain ledger reinforces the flow story. Wallets holding 1,000 BTC or more
have added 270,000 BTC over the last 30 days, the largest single-month
accumulation since 2013, while exchange reserves have fallen to a 7-year low
last seen in December 2017. Both signals point to long-term holder absorption
rather than retail-driven momentum.
The risk
gauge sits in the recent ETF tape. April 29 saw $89 million in net IBIT
outflows, the largest single-day sell-off of the month and the end of a
nine-day consecutive inflow streak.
As the
FinanceMagnates.com eToro CEO Bitcoin price prediction
analysis detailed,
weekly ETF inflows of $1.1 billion in mid-April were already tracking the
strongest pace since January, and a sustained reversal would put the breakout
thesis on hold.
Bitcoin Technical
Analysis: $75K Floor, $82K Ceiling, $92K-$98K If Breakout Holds
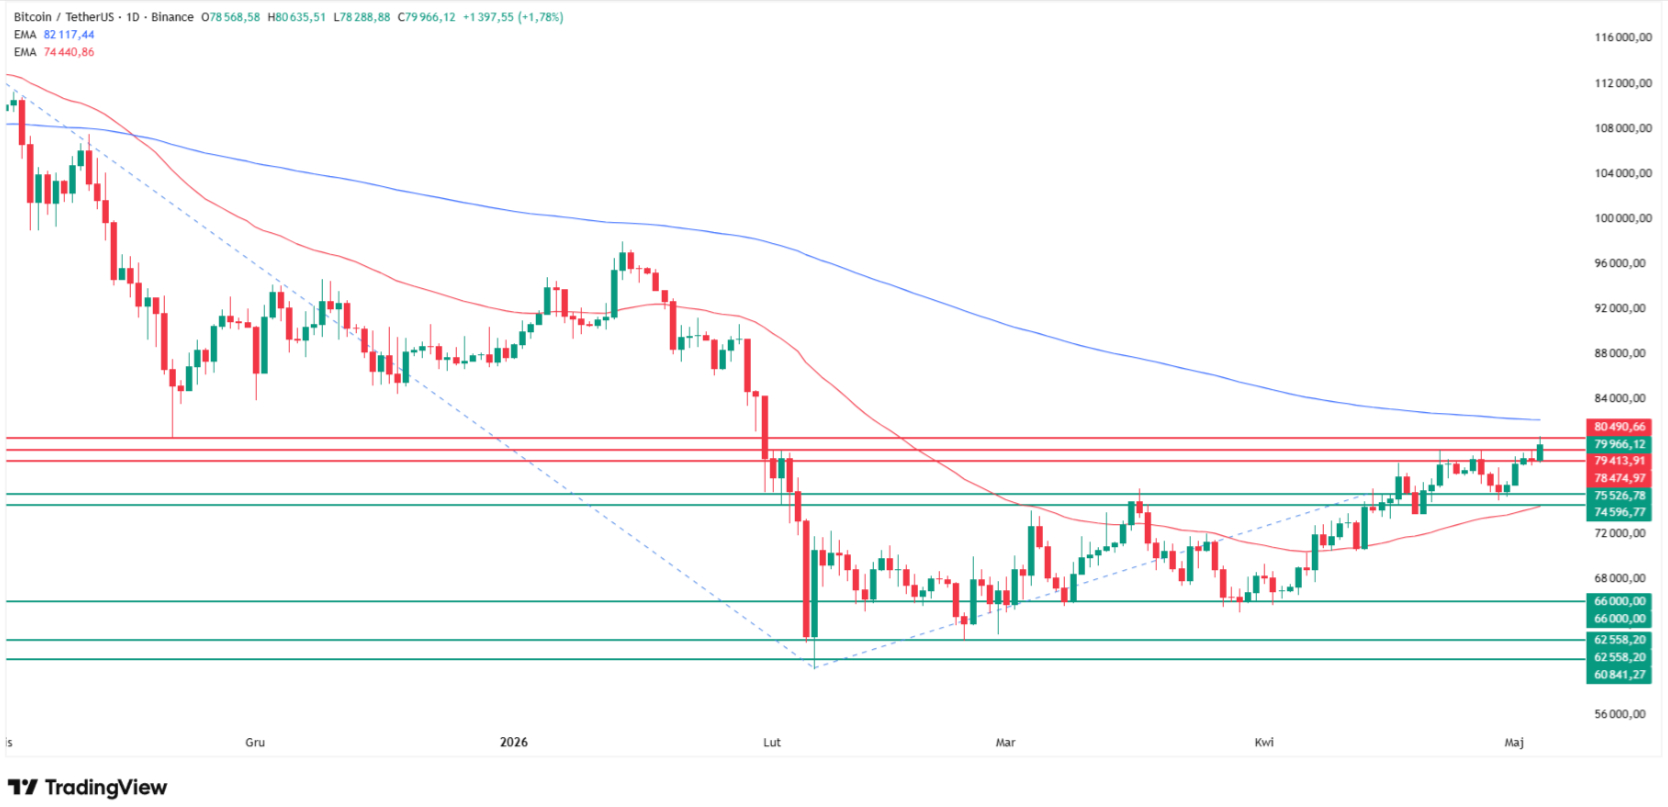
My daily
chart shows Bitcoin testing the upper boundary of a four-month consolidation
range that runs from roughly $75,000 to just under $82,000. The $75,000 floor
is reinforced by November 2025 lows, by the mid-March local top now flipped to
support, and by the rising 50-day moving average converging into the same zone.
The 200-day
moving average sits just above the consolidation top at roughly $82,000,
creating a confluence of resistance that has rejected every previous test since
January.
Today’s
$80,393 print breaks the consolidation top from the November range but stops
short of the 200 EMA. As I wrote in my $74K target analysis two weeks ago, accumulation at
$74K-$76K levels was the setup; today’s session is the first confirmation that
buyers showed up.
As I wrote during the March bounce coverage, the bounce off $63,000 lacked the
institutional-flow profile that this one has.
In 15 years
covering crypto and forex markets as Damian Chmiel, I’ve watched the 200-day EMA decide every
multi-month BTC consolidation since 2022. The next daily close above $82,000 is
the only confirmation that matters on my framework; everything before that is a
wick.
“Bitcoin
update. The price nicely held that $74k-76k zone and BTC is now trading above
$80k. I personally hate early week breakouts but now that we have this
breakout, today’s low is going to be key to hold moving forward,” wrote
Crypto Mechanic on X.
Bitcoin update
The price nicely held that $74k-76k zone and $BTC is now trading above $80k.I personally hate early week breakouts but now that we have this breakout, today’s low is going to be key to hold moving forward. We can keep this low as our invalidation for further… https://t.co/mxqv3LwRU1 pic.twitter.com/2gAtefP8ua
— Crypto Mechanic (@CryptomechanicX)
The
trader’s framing matches my read: today’s daily low becomes the breakout
invalidation level, and a daily close back below it puts BTC inside the
consolidation band again.
|
Level |
Type |
Notes |
|
$98,000 |
Resistance |
Dec 2025 |
|
$92,000 |
Resistance |
Lower end |
|
$84,500 |
Resistance |
Closed CME gap |
|
$83,000 |
Resistance |
Average |
|
$82,000 |
Resistance |
200-day |
|
$80,000 |
Pivot |
Psychological |
|
$75,000 |
Support |
50-day MA |
|
$66,000 |
Support |
Early April 2026 swing low |
|
$61,000-$62,600 |
Support |
Lower consolidation floor |
If BTC
fails to clear $82,000 on a daily close, my base case is a corrective retest of
$75,000. A break of $75,000 opens $66,000 as the next stop, with $61,000 to
$62,600 as the deeper structural floor. A clean break above $82,000 unlocks the
$92,000 to $98,000 zone last traded five months ago.
Bitcoin Price Predictions:
Bull and Bear Scenarios
External
targets remain wide. As I covered in my April $240K bull-case analysis, Q1 2026 ETF inflows reached $18.7
billion despite a 23% price drop, and institutional conviction never
disappeared. The FinanceMagnates.com Standard Chartered and Bernstein
revision report
still puts year-end 2026 consensus at $150,000.
“Bitcoin
broke above $80k. Highest in 3 months, key psychological level, middle of
massive CME gap, above Bull Market Support Band for first time in 6 months,
above key on-chain levels,” posted Nic on X.
Bitcoin broke above $80k!
Here’s why that’s important:
– Highest in 3 months
– Key psychological level
– Middle of massive CME gap ($79k – 84k)
– Above Bull Market Support Band for first time in 6 months
– Above key on-chain levels (True market mean, Short-term holder realised… pic.twitter.com/KawYtnqcdX— Nic (@nicrypto)
The trader
flagged $83,000 as the average ETF cost basis and $84,500 as the closed CME gap
target. Both sit inside my consolidation top zone, which means neither would
confirm a directional trend on my framework; the 200 EMA does that work.
|
Source |
Target |
Date / Notes |
My one-line view |
|
Damian Chmiel (FinanceMagnates.com) |
$92K-$98K |
Daily |
Upper |
|
Crypto Mechanic |
“More upside” |
Conditional |
Aligns |
|
Nic (@nicrypto) |
$83K then $84.5K |
ETF cost |
Both sit |
|
Standard Chartered |
$150,000 |
Year-end 2026 (Dec 2025 revision) |
Achievable |
|
Bit Mining (Wei Yang) |
$225,000 |
Year-end |
Requires |
|
24/7 Wall St / consensus |
$73.5K-$83.5K |
May 2026 range |
Matches |
Bitcoin Price Prediction
FAQ
Why is Bitcoin price going
up today?
Bitcoin is
up over 2% to $79,810 on Monday, May 4, 2026, on three converging catalysts:
Trump’s response to Iran’s 14-point peace proposal cooled oil-linked inflation
expectations, Brent crude fell to $107 from a four-year high, and BTC reclaimed
the bull market support band for the first time in six months. ETF flows turned
positive in late April after a brief reversal, with $629 million in MTD
inflows.
How high can Bitcoin go in
May 2026?
My daily
chart targets the $92,000 to $98,000 zone on a clean daily close above $82,000,
the December 2025 to January 2026 highs cluster. Below that, the immediate
technical magnets are $83,000 (average ETF cost basis) and $84,500 (closed CME
gap). The 24/7 Wall St consensus pegs the May range at $73,500 to $83,500, with
$85,000 to $88,000 unlocked only on a confirmed $80,000 monthly close.
What does Bitcoin need to
break above $80,000 sustainably?
A daily
close above the 200-day moving average at roughly $82,000 is the only
confirmation that matters on my framework. Anything below that level keeps BTC
inside the consolidation band that has defined trading since November 2025. The
supporting conditions are continued spot ETF inflows above $300 million weekly,
no Iran ceasefire collapse, and a softer dollar tone from the incoming Fed
Chair this month.
Where would Bitcoin go if
the $80,000 breakout fails?
A failed
daily close above $82,000 sends BTC back to test the $75,000 floor, where the
50-day moving average and the November 2025 lows form the strongest confluence
on the chart. A break of $75,000 opens $66,000 as the next stop, the early
April 2026 swing low. Below $66,000, the deeper structural floor sits at
$61,000 to $62,600, the lower consolidation boundary.
What are Bitcoin price
predictions for 2026?
Year-end
2026 institutional targets span $130,000 (Bloomberg’s Eric Balchunas, on the
lower end) to $225,000 (Bit Mining’s Wei Yang, on the bullish side). Consensus
clusters at $150,000, the figure Standard Chartered and Bernstein both adopted
in their December 2025 revisions. Grayscale projects a new all-time high above
$126,198 by mid-2026, contingent on improving macro conditions and sustained
ETF inflows.
Bitcoin (BTC) is surging at
$79,810 on Monday, May 4, 2026, after touching $80,393 in early Singapore
hours, the cryptocurrency’s highest print since Jan. 31, 2026. The move pushed
BTC above the $80,000 psychological level for the first time in three months
and reclaimed the bull market support band that had capped every recovery
attempt since November 2025.
Asian
equity benchmarks neared record highs in the same session, and Ether traded
higher in sympathy.
The rally
followed President Donald Trump’s announcement that the United States had
responded to Iran’s 14-point peace proposal and would begin escorting
commercial vessels through the Strait of Hormuz, sending U.S. crude futures
lower by nearly 5% and easing the macro headwind that had weighed on risk
assets through the first quarter.
Follow
me on X for real-time Bitcoin analysis: @ChmielDk
Iran De-escalation, Oil
Drop, and the $80K Psychological Break
The
catalyst stack is geopolitical first, technical second. Brent crude fell to
$107 per barrel from a four-year high after Iran sent its updated proposal to
mediators in Pakistan on May 1, and the U.S. response signaled a path away from
a full Strait of Hormuz closure that had kept oil-linked inflation expectations
elevated for two months. Risk assets reopened the conversation about Federal
Reserve policy as soon as the oil tape moved.
“Markets
are consolidating in a cautious tone as Middle East tensions drive oil-linked
inflation risks, keeping the US Dollar supported and central bank expectations
tilted hawkish while limiting conviction across risk assets,” said Joel
Kruger, Market Analyst at LMAX Group.
Kruger’s
read frames the move as a relief rally rather than a decisive trend break, with
the dollar trajectory still the gating variable for risk assets.
The same
dynamic played out in the FinanceMagnates.com April analysis on the Iran ceasefire
and short squeeze setup, which tracked $471 million in single-day spot ETF inflows on April 6
and a $427 million short squeeze as the precursor conditions to the $80,000
test now unfolding. Three further drivers compound the move:
- Trump-Iran de-escalation: U.S. crude futures fell
roughly 5%, with Brent at $107 from a four-year high near $130 - Strait of Hormuz commercial
escort:
removes the immediate tail-risk premium on oil and dollar - Bull market support band
reclaim: first
BTC close above the band in six months - CME gap fill thesis: $79K-$84K gap pulls price
toward the upper consolidation band - Average ETF cost basis at $83K: mechanical magnet if the
breakout holds
Bitcoin ETF Flows and
On-Chain Signals: The Institutional Bid Underneath
Spot
Bitcoin ETF demand explains the timing of the breakout. April closed with $2.44
billion in net inflows, the strongest institutional month since October 2025,
while May-to-date net inflows have already cleared $629 million per fund-level
tracking.
Cumulative
net inflows since the January 2024 launch stand at $58.5 billion, with
BlackRock’s IBIT holding roughly 812,000 BTC and commanding 62% market share.
Morgan Stanley’s MSBT, which launched April 8, drew over $100 million in its
first six trading days.
The
on-chain ledger reinforces the flow story. Wallets holding 1,000 BTC or more
have added 270,000 BTC over the last 30 days, the largest single-month
accumulation since 2013, while exchange reserves have fallen to a 7-year low
last seen in December 2017. Both signals point to long-term holder absorption
rather than retail-driven momentum.
The risk
gauge sits in the recent ETF tape. April 29 saw $89 million in net IBIT
outflows, the largest single-day sell-off of the month and the end of a
nine-day consecutive inflow streak.
As the
FinanceMagnates.com eToro CEO Bitcoin price prediction
analysis detailed,
weekly ETF inflows of $1.1 billion in mid-April were already tracking the
strongest pace since January, and a sustained reversal would put the breakout
thesis on hold.
Bitcoin Technical
Analysis: $75K Floor, $82K Ceiling, $92K-$98K If Breakout Holds
My daily
chart shows Bitcoin testing the upper boundary of a four-month consolidation
range that runs from roughly $75,000 to just under $82,000. The $75,000 floor
is reinforced by November 2025 lows, by the mid-March local top now flipped to
support, and by the rising 50-day moving average converging into the same zone.
The 200-day
moving average sits just above the consolidation top at roughly $82,000,
creating a confluence of resistance that has rejected every previous test since
January.
Today’s
$80,393 print breaks the consolidation top from the November range but stops
short of the 200 EMA. As I wrote in my $74K target analysis two weeks ago, accumulation at
$74K-$76K levels was the setup; today’s session is the first confirmation that
buyers showed up.
As I wrote during the March bounce coverage, the bounce off $63,000 lacked the
institutional-flow profile that this one has.
In 15 years
covering crypto and forex markets as Damian Chmiel, I’ve watched the 200-day EMA decide every
multi-month BTC consolidation since 2022. The next daily close above $82,000 is
the only confirmation that matters on my framework; everything before that is a
wick.
“Bitcoin
update. The price nicely held that $74k-76k zone and BTC is now trading above
$80k. I personally hate early week breakouts but now that we have this
breakout, today’s low is going to be key to hold moving forward,” wrote
Crypto Mechanic on X.
Bitcoin update
The price nicely held that $74k-76k zone and $BTC is now trading above $80k.I personally hate early week breakouts but now that we have this breakout, today’s low is going to be key to hold moving forward. We can keep this low as our invalidation for further… https://t.co/mxqv3LwRU1 pic.twitter.com/2gAtefP8ua
— Crypto Mechanic (@CryptomechanicX)
The
trader’s framing matches my read: today’s daily low becomes the breakout
invalidation level, and a daily close back below it puts BTC inside the
consolidation band again.
|
Level |
Type |
Notes |
|
$98,000 |
Resistance |
Dec 2025 |
|
$92,000 |
Resistance |
Lower end |
|
$84,500 |
Resistance |
Closed CME gap |
|
$83,000 |
Resistance |
Average |
|
$82,000 |
Resistance |
200-day |
|
$80,000 |
Pivot |
Psychological |
|
$75,000 |
Support |
50-day MA |
|
$66,000 |
Support |
Early April 2026 swing low |
|
$61,000-$62,600 |
Support |
Lower consolidation floor |
If BTC
fails to clear $82,000 on a daily close, my base case is a corrective retest of
$75,000. A break of $75,000 opens $66,000 as the next stop, with $61,000 to
$62,600 as the deeper structural floor. A clean break above $82,000 unlocks the
$92,000 to $98,000 zone last traded five months ago.
Bitcoin Price Predictions:
Bull and Bear Scenarios
External
targets remain wide. As I covered in my April $240K bull-case analysis, Q1 2026 ETF inflows reached $18.7
billion despite a 23% price drop, and institutional conviction never
disappeared. The FinanceMagnates.com Standard Chartered and Bernstein
revision report
still puts year-end 2026 consensus at $150,000.
“Bitcoin
broke above $80k. Highest in 3 months, key psychological level, middle of
massive CME gap, above Bull Market Support Band for first time in 6 months,
above key on-chain levels,” posted Nic on X.
Bitcoin broke above $80k!
Here’s why that’s important:
– Highest in 3 months
– Key psychological level
– Middle of massive CME gap ($79k – 84k)
– Above Bull Market Support Band for first time in 6 months
– Above key on-chain levels (True market mean, Short-term holder realised… pic.twitter.com/KawYtnqcdX— Nic (@nicrypto)
The trader
flagged $83,000 as the average ETF cost basis and $84,500 as the closed CME gap
target. Both sit inside my consolidation top zone, which means neither would
confirm a directional trend on my framework; the 200 EMA does that work.
|
Source |
Target |
Date / Notes |
My one-line view |
|
Damian Chmiel (FinanceMagnates.com) |
$92K-$98K |
Daily |
Upper |
|
Crypto Mechanic |
“More upside” |
Conditional |
Aligns |
|
Nic (@nicrypto) |
$83K then $84.5K |
ETF cost |
Both sit |
|
Standard Chartered |
$150,000 |
Year-end 2026 (Dec 2025 revision) |
Achievable |
|
Bit Mining (Wei Yang) |
$225,000 |
Year-end |
Requires |
|
24/7 Wall St / consensus |
$73.5K-$83.5K |
May 2026 range |
Matches |
Bitcoin Price Prediction
FAQ
Why is Bitcoin price going
up today?
Bitcoin is
up over 2% to $79,810 on Monday, May 4, 2026, on three converging catalysts:
Trump’s response to Iran’s 14-point peace proposal cooled oil-linked inflation
expectations, Brent crude fell to $107 from a four-year high, and BTC reclaimed
the bull market support band for the first time in six months. ETF flows turned
positive in late April after a brief reversal, with $629 million in MTD
inflows.
How high can Bitcoin go in
May 2026?
My daily
chart targets the $92,000 to $98,000 zone on a clean daily close above $82,000,
the December 2025 to January 2026 highs cluster. Below that, the immediate
technical magnets are $83,000 (average ETF cost basis) and $84,500 (closed CME
gap). The 24/7 Wall St consensus pegs the May range at $73,500 to $83,500, with
$85,000 to $88,000 unlocked only on a confirmed $80,000 monthly close.
What does Bitcoin need to
break above $80,000 sustainably?
A daily
close above the 200-day moving average at roughly $82,000 is the only
confirmation that matters on my framework. Anything below that level keeps BTC
inside the consolidation band that has defined trading since November 2025. The
supporting conditions are continued spot ETF inflows above $300 million weekly,
no Iran ceasefire collapse, and a softer dollar tone from the incoming Fed
Chair this month.
Where would Bitcoin go if
the $80,000 breakout fails?
A failed
daily close above $82,000 sends BTC back to test the $75,000 floor, where the
50-day moving average and the November 2025 lows form the strongest confluence
on the chart. A break of $75,000 opens $66,000 as the next stop, the early
April 2026 swing low. Below $66,000, the deeper structural floor sits at
$61,000 to $62,600, the lower consolidation boundary.
What are Bitcoin price
predictions for 2026?
Year-end
2026 institutional targets span $130,000 (Bloomberg’s Eric Balchunas, on the
lower end) to $225,000 (Bit Mining’s Wei Yang, on the bullish side). Consensus
clusters at $150,000, the figure Standard Chartered and Bernstein both adopted
in their December 2025 revisions. Grayscale projects a new all-time high above
$126,198 by mid-2026, contingent on improving macro conditions and sustained
ETF inflows.
Search
RECENT PRESS RELEASES
Opinion | A.I. Is a National Security Risk. We Aren’t Doing Nearly Enough.
SWI Editorial Staff2026-05-04T02:01:54-07:00May 4, 2026|
A visit to the Ohio county where renewable energy is on the ballot
SWI Editorial Staff2026-05-04T01:57:00-07:00May 4, 2026|
Tech stocks see largest hedge fund selloff in decade: Goldman Sachs
SWI Editorial Staff2026-05-04T01:46:01-07:00May 4, 2026|
South Korea Automotive Sunroof Market: Passenger Demand & Forecast to 2034
SWI Editorial Staff2026-05-04T01:34:31-07:00May 4, 2026|
Indonesia stocks higher at close of trade; IDX Composite Index up 0.08%
SWI Editorial Staff2026-05-04T01:30:00-07:00May 4, 2026|
Are European automakers driving into the defense market? Analysts say to tap the brakes.
SWI Editorial Staff2026-05-04T01:30:00-07:00May 4, 2026|
Related Post


