Why XRP Is Going Down? Crypto Falls Today With Bitcoin and Could Drop 50% According to Thi
November 3, 2025
XRP price plunged
4.73% today (Monday), 3 November 2025, to $2.407, emerging as one of the
weakest major altcoins as broader cryptocurrency market weakness intensified
and the newest XRP price prediction points to a potential 50% decline toward
$1.25.
According
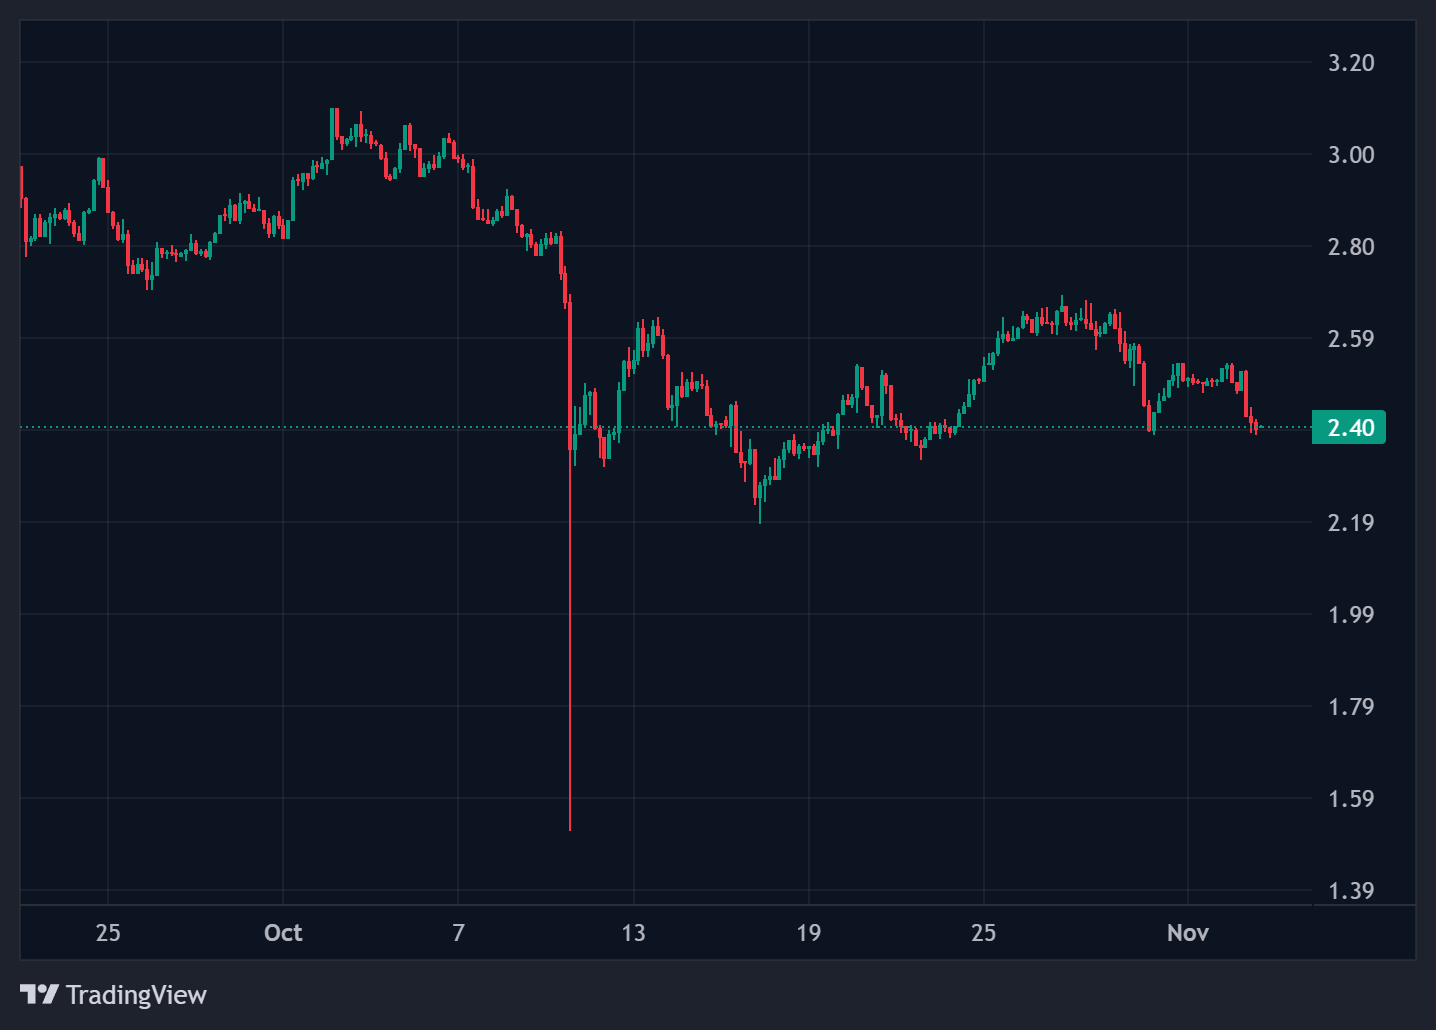
to my technical analysis of the daily XRP/USDT chart, the cryptocurrency is one
of the most heavily declining major altcoins. It is testing the $2.38 level,
which represents the daily minimum, and is currently exchanging hands at $2.40.
|
XRP Decline Metrics |
November 3, 2025 |
|
Current Price |
$2.407 |
|
Daily Change |
-$0.119 (-4.73%) |
|
Intraday Low |
$2.381 |
|
Session Range |
$2.381-$2.533 |
|
October Performance |
-12.04% |
|
Market Cap |
$135.2 billion |
As visible
on the chart below, prices are currently stuck in a narrow consolidation at
levels last observed in early July. The range of this consolidation falls
between the $2.20-$2.30 level, a support zone at multi-month lows, and the
resistance zone of $2.59-$2.70, which simultaneously houses two important
exponential averages, namely the 50 EMA and 200 EMA.
Why XRP Is Going Down
Today?
Broader Crypto Weakness
Pressures XRP
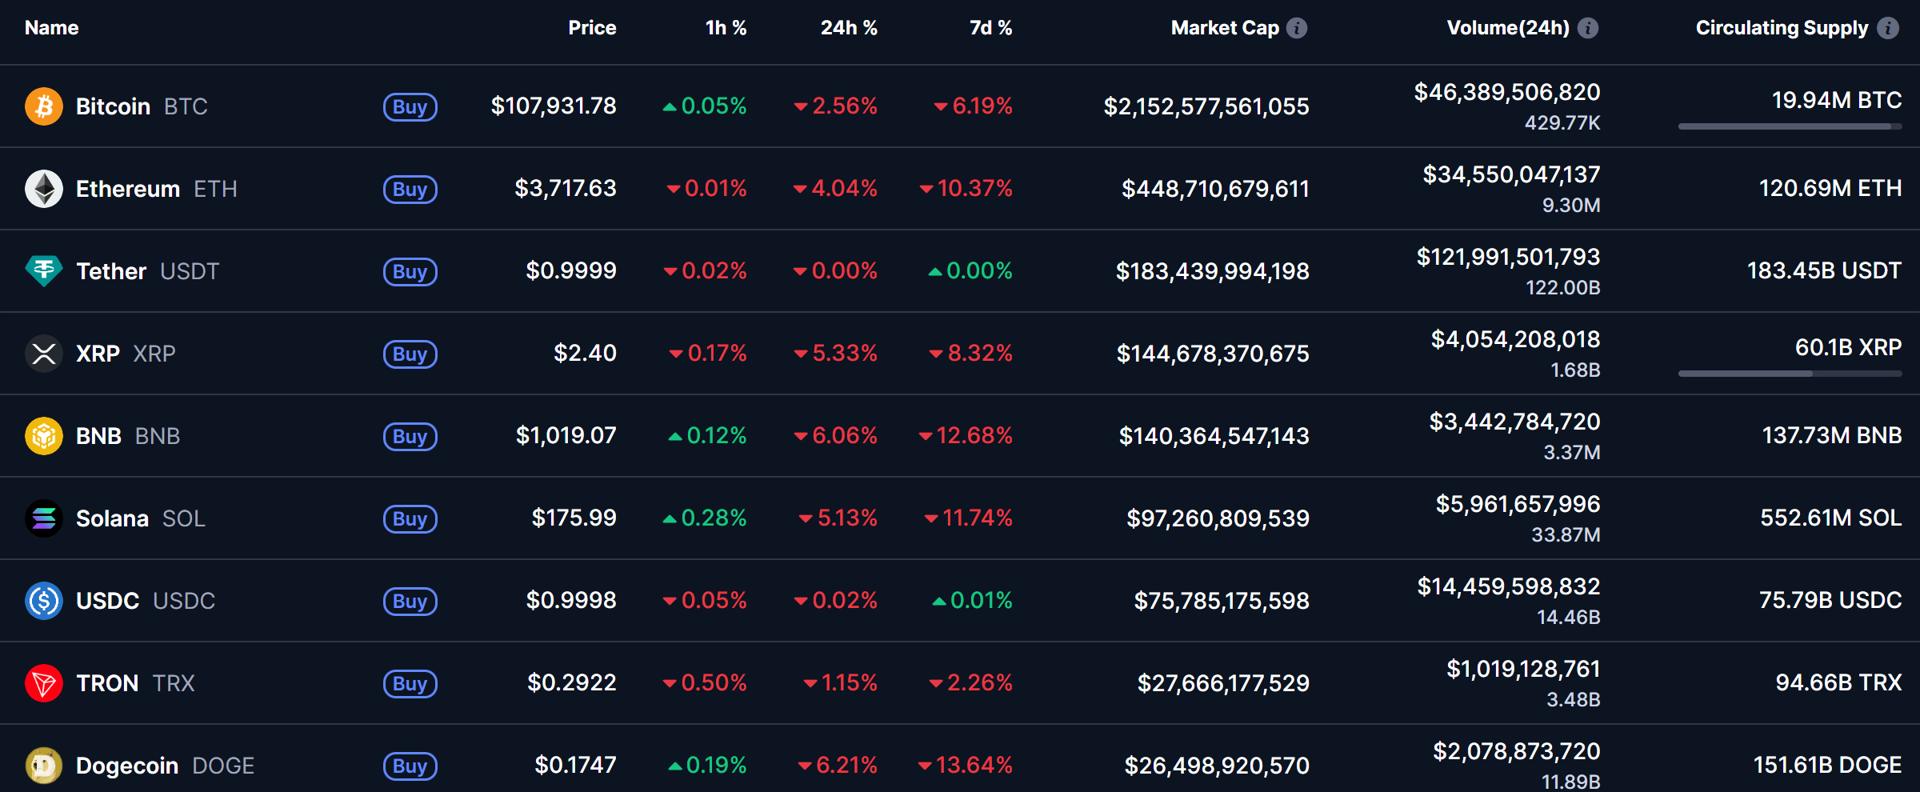
XRP’s
weakness stems from the general downward trend in the cryptocurrency market
observed in the last 24 hours. Bitcoin is losing 2.5% and falling below
$108,000, Ethereum is giving up 4% of its value testing the $3,720 level, and
falling more strongly than XRP are BNB dropping 6% to $1,020 and Solana sliding
5.5% to $176. The meme cryptocurrency Dogecoin is falling 6.2% daily and costs
just over 17 cents, according to current data from CoinMarketCap.
Simon
Peters, crypto analyst at eToro, explained the broader market context:
“Crypto markets retreated 6.5% last week, after Fed Chairman Powell
signalled that a December interest rate cut is not a foregone conclusion, which
dampened investors expectations for looser financial conditions going forward
in the short-term.”
The shift
in Federal Reserve expectations proved dramatic. “Leading up to last
Wednesday’s interest rate decision, the market’s probability of a cut at
December’s FOMC meeting stood as high as 96%. After the press conference this
dropped drastically to less than 70% chance,” Peters noted.
You may also like: This XRP Price Prediction From Ex-Goldman Analyst Eyes $1,000 by 2030
Dollar Strength
Automatically Pressures Crypto
Cryptocurrencies
are also not being served by the current fundamental picture of broader markets
and the fact that the dollar is strengthening for a fourth consecutive session
and is currently the strongest in 3 months. Cryptocurrencies valued in dollars
therefore suffer from this automatically.
The dollar
index reached its highest levels since August, creating powerful headwinds for
dollar-denominated assets. This currency dynamic amplifies selling pressure
across the entire cryptocurrency complex, with altcoins like XRP exhibiting
greater sensitivity to dollar strength than Bitcoin .
Joel
Kruger, strategist at LMAX, provided perspective on October’s performance:
“October proved to be a mild disappointment for those leaning on
historical seasonality and trend analysis. Traditionally one of Bitcoin’s
stronger months, October finally broke its six-year streak of positive
performance, ending roughly 3.7% lower. Yet, this modest decline should be
viewed in perspective rather than alarm.”
XRP Technical Analysis:
Wedge Breakdown Signals Bearish Trend
XRP found
itself in this range after breaking out of a wedge formation drawn from summer
highs, which was broken downward, simultaneously denying the potential bullish
connotation of this arrangement. According to my technical analysis, I
currently forecast that XRP’s price may decline in the short and medium term,
and the impulse for this will be breaking out of the current green-marked
support zone.
The falling
wedge pattern, typically considered a bullish formation, was invalidated when
prices broke to the downside rather than rallying upward. This technical
failure creates a bearish setup where previous support levels become vulnerable
to breakdown.
XRP Price Prediction: 50%
Decline Target at $1.25 via Fibonacci Extension
My bearish
targets include the zone of the round $2.00 level combined with $1.90, the June
minimums, then the $1.61 level representing lows from the first part of this
year, and ultimately the level of just $1.25. This level coincides with the
intraday minimum from October 10 when there was strong deleveraging of
cryptocurrency positions and its momentary collapse.
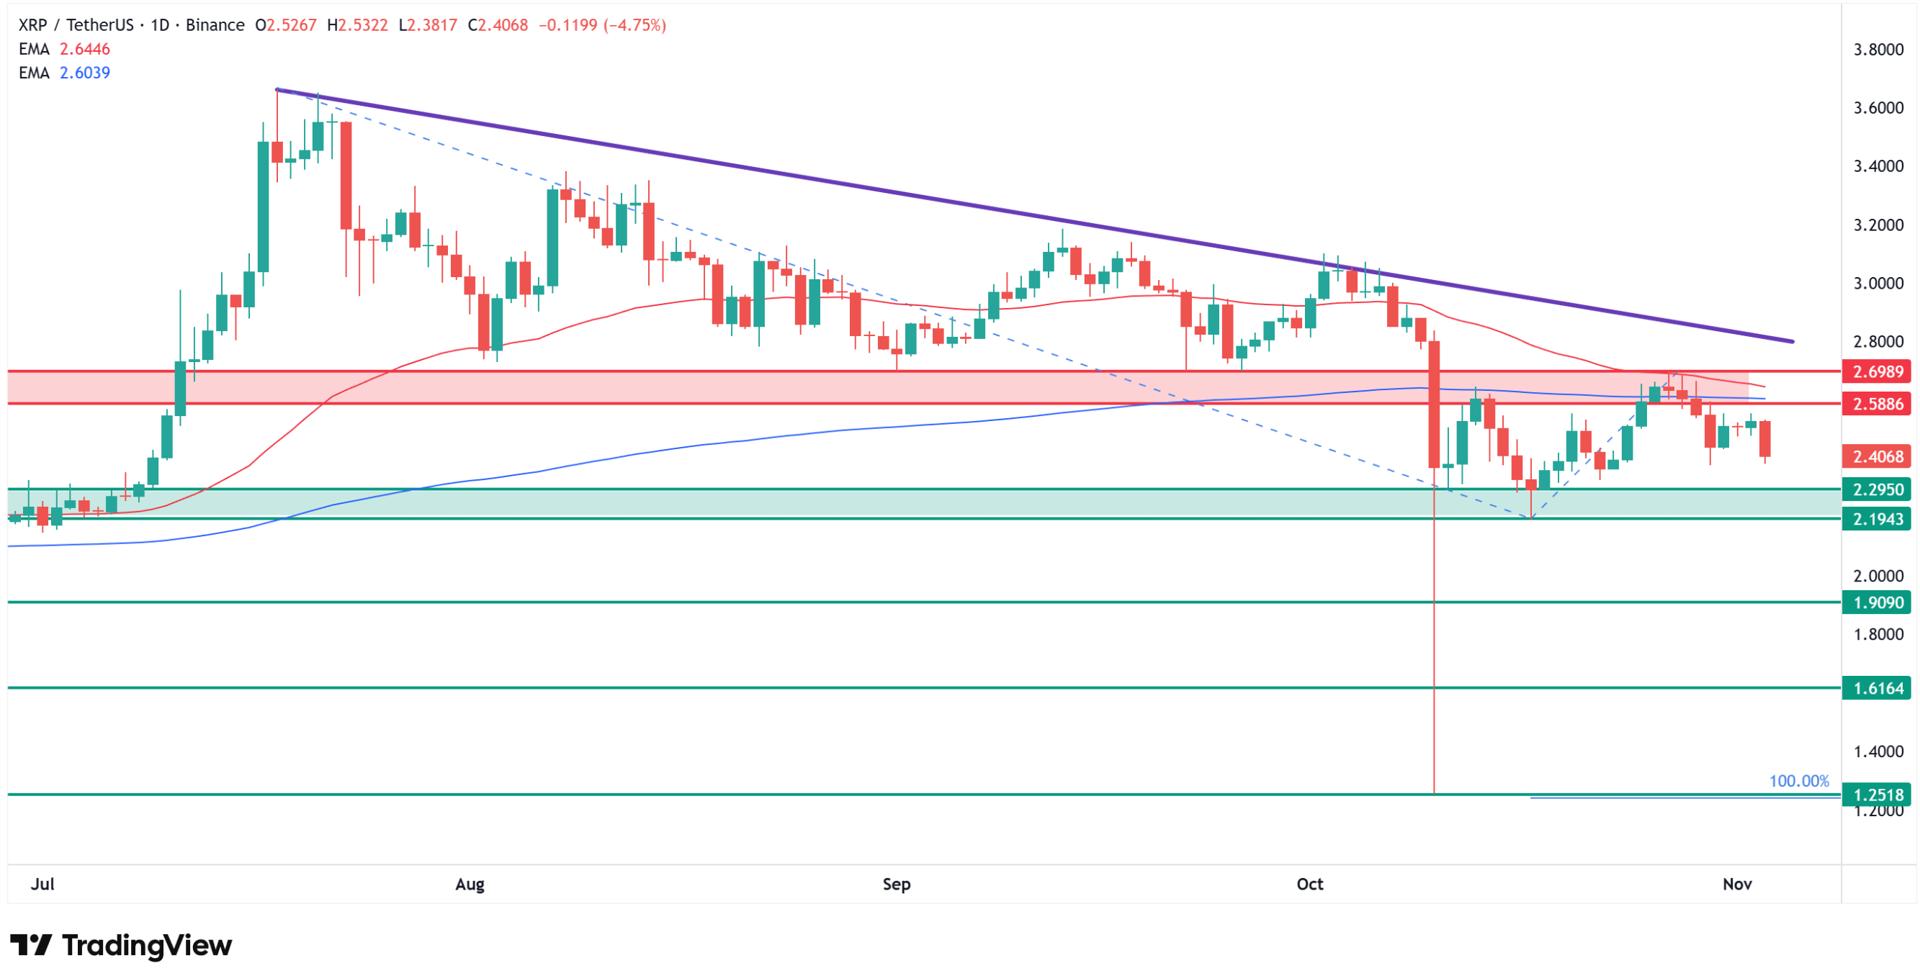
Most
significantly, this $1.25 level also coincides with Fibonacci extensions, and
at this height falls the 100% extension of the current downtrend from July
highs to October lows, and then the upward correction observed over the last 2
weeks. This would mean that from current levels, XRP’s price could decline by
50%.
|
XRP Bearish Price Targets |
Level |
Decline from Current |
Technical Significance |
|
Current Price |
$2.407 |
— |
Consolidation zone |
|
Immediate Support |
$2.20-$2.30 |
-9% to -4% |
Multi-month lows |
|
First Target |
$2.00-$1.90 |
-17% to -21% |
June 2025 minimums |
|
Second Target |
$1.61 |
-33% |
Q1 2025 lows |
|
Ultimate Target |
$1.25 |
-48% to -50% |
Oct 10 low + Fibonacci 100% |
Both the
50-day exponential moving average at $2.712 and the 200-day EMA at $2.622 sit
above current prices, creating a formidable resistance ceiling in the
$2.59-$2.70 zone. This technical setup is bearish, prices trading below both
major moving averages typically indicate downtrends with momentum favoring
sellers.
XRP Price Analysis, FAQ
Why is XRP falling today?
XRP dropped
4.73% to $2.407 Monday as weakest major altcoin amid broader crypto weakness
(Bitcoin -2.5%, Ethereum -4%, BNB -6%, Solana -5.5%), dollar strengthening
fourth consecutive session to 3-month highs automatically pressuring
dollar-denominated cryptocurrencies, Fed Chairman Powell walking back December
rate cut expectations (probability collapsed from 96% to below 70% per Simon
Peters eToro), wedge formation broken downward contradicting bullish
connotation, long-term holder outflows accelerating 2,647% to -90.14M XRP
indicating institutional distribution.
How low can XRP price go?
According
to my technical analysis, XRP could decline 50% from current $2.407 to ultimate
target $1.25 via staged breakdown: first support failure $2.20-$2.30 opening
path to $2.00-$1.90 (-17% to -21%), then $1.61 Q1 2025 lows (-33%), ultimately
$1.25 coinciding with October 10 deleveraging crash low and Fibonacci 100%
extension (-48% to -50%), with resistance overhead at $2.59-$2.70 housing
50-day EMA $2.712 and 200-day EMA $2.622 creating bearish ceiling.
Will XRP price fall?
My
Fibonacci technical analysis shows $1.25 represents 100% extension of downtrend
from July highs to October lows measured from recent two-week correction,
coinciding with October 10 deleveraging event intraday low when cascading
liquidations pushed XRP to this level, requiring breakdown below current
$2.20-$2.30 support then $2.00/$1.90 and $1.61 levels, with Changelly
algorithmic forecast also showing bearish 2026 path declining to $1.34 by
December 2026 broadly consistent with substantial downside scenario.
Is XRP a sell now?
Yes. XRP
trading below both 50-day EMA $2.712 and 200-day EMA $2.622 (bearish technical
structure), wedge broken downward invalidating bullish formation, repeated
$2.55 resistance rejections with 85% above-average volume confirming
institutional distribution, long-term holder outflows +2,647% and short-term
supply share -39.5% showing capitulation, though recovery above $2.59-$2.70
resistance would invalidate bearish setup, requires individual risk assessment
considering potential 50% downside versus recovery scenarios if adoption
accelerates.
You may also be interested in my previous analyses and predictions on XRP prices:
XRP price plunged
4.73% today (Monday), 3 November 2025, to $2.407, emerging as one of the
weakest major altcoins as broader cryptocurrency market weakness intensified
and the newest XRP price prediction points to a potential 50% decline toward
$1.25.
According
to my technical analysis of the daily XRP/USDT chart, the cryptocurrency is one
of the most heavily declining major altcoins. It is testing the $2.38 level,
which represents the daily minimum, and is currently exchanging hands at $2.40.
|
XRP Decline Metrics |
November 3, 2025 |
|
Current Price |
$2.407 |
|
Daily Change |
-$0.119 (-4.73%) |
|
Intraday Low |
$2.381 |
|
Session Range |
$2.381-$2.533 |
|
October Performance |
-12.04% |
|
Market Cap |
$135.2 billion |
As visible
on the chart below, prices are currently stuck in a narrow consolidation at
levels last observed in early July. The range of this consolidation falls
between the $2.20-$2.30 level, a support zone at multi-month lows, and the
resistance zone of $2.59-$2.70, which simultaneously houses two important
exponential averages, namely the 50 EMA and 200 EMA.
Why XRP Is Going Down
Today?
Broader Crypto Weakness
Pressures XRP
XRP’s
weakness stems from the general downward trend in the cryptocurrency market
observed in the last 24 hours. Bitcoin is losing 2.5% and falling below
$108,000, Ethereum is giving up 4% of its value testing the $3,720 level, and
falling more strongly than XRP are BNB dropping 6% to $1,020 and Solana sliding
5.5% to $176. The meme cryptocurrency Dogecoin is falling 6.2% daily and costs
just over 17 cents, according to current data from CoinMarketCap.
Simon
Peters, crypto analyst at eToro, explained the broader market context:
“Crypto markets retreated 6.5% last week, after Fed Chairman Powell
signalled that a December interest rate cut is not a foregone conclusion, which
dampened investors expectations for looser financial conditions going forward
in the short-term.”
The shift
in Federal Reserve expectations proved dramatic. “Leading up to last
Wednesday’s interest rate decision, the market’s probability of a cut at
December’s FOMC meeting stood as high as 96%. After the press conference this
dropped drastically to less than 70% chance,” Peters noted.
You may also like: This XRP Price Prediction From Ex-Goldman Analyst Eyes $1,000 by 2030
Dollar Strength
Automatically Pressures Crypto
Cryptocurrencies
are also not being served by the current fundamental picture of broader markets
and the fact that the dollar is strengthening for a fourth consecutive session
and is currently the strongest in 3 months. Cryptocurrencies valued in dollars
therefore suffer from this automatically.
The dollar
index reached its highest levels since August, creating powerful headwinds for
dollar-denominated assets. This currency dynamic amplifies selling pressure
across the entire cryptocurrency complex, with altcoins like XRP exhibiting
greater sensitivity to dollar strength than Bitcoin .
Joel
Kruger, strategist at LMAX, provided perspective on October’s performance:
“October proved to be a mild disappointment for those leaning on
historical seasonality and trend analysis. Traditionally one of Bitcoin’s
stronger months, October finally broke its six-year streak of positive
performance, ending roughly 3.7% lower. Yet, this modest decline should be
viewed in perspective rather than alarm.”
XRP Technical Analysis:
Wedge Breakdown Signals Bearish Trend
XRP found
itself in this range after breaking out of a wedge formation drawn from summer
highs, which was broken downward, simultaneously denying the potential bullish
connotation of this arrangement. According to my technical analysis, I
currently forecast that XRP’s price may decline in the short and medium term,
and the impulse for this will be breaking out of the current green-marked
support zone.
The falling
wedge pattern, typically considered a bullish formation, was invalidated when
prices broke to the downside rather than rallying upward. This technical
failure creates a bearish setup where previous support levels become vulnerable
to breakdown.
XRP Price Prediction: 50%
Decline Target at $1.25 via Fibonacci Extension
My bearish
targets include the zone of the round $2.00 level combined with $1.90, the June
minimums, then the $1.61 level representing lows from the first part of this
year, and ultimately the level of just $1.25. This level coincides with the
intraday minimum from October 10 when there was strong deleveraging of
cryptocurrency positions and its momentary collapse.
Most
significantly, this $1.25 level also coincides with Fibonacci extensions, and
at this height falls the 100% extension of the current downtrend from July
highs to October lows, and then the upward correction observed over the last 2
weeks. This would mean that from current levels, XRP’s price could decline by
50%.
|
XRP Bearish Price Targets |
Level |
Decline from Current |
Technical Significance |
|
Current Price |
$2.407 |
— |
Consolidation zone |
|
Immediate Support |
$2.20-$2.30 |
-9% to -4% |
Multi-month lows |
|
First Target |
$2.00-$1.90 |
-17% to -21% |
June 2025 minimums |
|
Second Target |
$1.61 |
-33% |
Q1 2025 lows |
|
Ultimate Target |
$1.25 |
-48% to -50% |
Oct 10 low + Fibonacci 100% |
Both the
50-day exponential moving average at $2.712 and the 200-day EMA at $2.622 sit
above current prices, creating a formidable resistance ceiling in the
$2.59-$2.70 zone. This technical setup is bearish, prices trading below both
major moving averages typically indicate downtrends with momentum favoring
sellers.
XRP Price Analysis, FAQ
Why is XRP falling today?
XRP dropped
4.73% to $2.407 Monday as weakest major altcoin amid broader crypto weakness
(Bitcoin -2.5%, Ethereum -4%, BNB -6%, Solana -5.5%), dollar strengthening
fourth consecutive session to 3-month highs automatically pressuring
dollar-denominated cryptocurrencies, Fed Chairman Powell walking back December
rate cut expectations (probability collapsed from 96% to below 70% per Simon
Peters eToro), wedge formation broken downward contradicting bullish
connotation, long-term holder outflows accelerating 2,647% to -90.14M XRP
indicating institutional distribution.
How low can XRP price go?
According
to my technical analysis, XRP could decline 50% from current $2.407 to ultimate
target $1.25 via staged breakdown: first support failure $2.20-$2.30 opening
path to $2.00-$1.90 (-17% to -21%), then $1.61 Q1 2025 lows (-33%), ultimately
$1.25 coinciding with October 10 deleveraging crash low and Fibonacci 100%
extension (-48% to -50%), with resistance overhead at $2.59-$2.70 housing
50-day EMA $2.712 and 200-day EMA $2.622 creating bearish ceiling.
Will XRP price fall?
My
Fibonacci technical analysis shows $1.25 represents 100% extension of downtrend
from July highs to October lows measured from recent two-week correction,
coinciding with October 10 deleveraging event intraday low when cascading
liquidations pushed XRP to this level, requiring breakdown below current
$2.20-$2.30 support then $2.00/$1.90 and $1.61 levels, with Changelly
algorithmic forecast also showing bearish 2026 path declining to $1.34 by
December 2026 broadly consistent with substantial downside scenario.
Is XRP a sell now?
Yes. XRP
trading below both 50-day EMA $2.712 and 200-day EMA $2.622 (bearish technical
structure), wedge broken downward invalidating bullish formation, repeated
$2.55 resistance rejections with 85% above-average volume confirming
institutional distribution, long-term holder outflows +2,647% and short-term
supply share -39.5% showing capitulation, though recovery above $2.59-$2.70
resistance would invalidate bearish setup, requires individual risk assessment
considering potential 50% downside versus recovery scenarios if adoption
accelerates.
You may also be interested in my previous analyses and predictions on XRP prices:
Search
RECENT PRESS RELEASES
Amazon Should Focus On Its ‘Deployment Milestone’ Instead Of Opposing SpaceX’s Massive Satellite Data Center Plan, Says Brendan Carr
SWI Editorial Staff2026-03-14T03:45:27-07:00March 14, 2026|
Want $1 Million in Retirement? 5 Simple Index Funds to Buy and Hold for Decades.
SWI Editorial Staff2026-03-14T03:32:00-07:00March 14, 2026|
Consumers to feel pinch from Iran clash even if stocks, dollar don’t
SWI Editorial Staff2026-03-14T03:24:01-07:00March 14, 2026|
Man to serve time for $2.5 million Hawaii bank investment scheme
SWI Editorial Staff2026-03-14T03:05:00-07:00March 14, 2026|
The Best Stocks to Invest $1,000 in Right Now
SWI Editorial Staff2026-03-14T03:05:00-07:00March 14, 2026|
Honda scraps 3 electric vehicle models planned for Ohio production
SWI Editorial Staff2026-03-14T03:03:44-07:00March 14, 2026|
Related Post


