Will Ethereum (ETH) Dodge Death Cross? XRP Paints Secret But Major Pattern, Dogecoin (DOGE) Might Surprise You
February 20, 2025
Advertisement
Due to its resilience, Ethereum is raising hopes that it can avoid the daily chart’s dreaded death cross formation. The 50-day moving average crossing below the 200-day MA, known as a death cross, frequently indicates bearish momentum and additional price drops. ETH bulls may have the opportunity to buck the trend before this situation plays out, though, based on recent price action.
The price chart for Ethereum shows that an upward trend is developing following ETH‘s recovery from its local bottom around $2,600. An increase in trading volume coincides with this recovery, indicating a resurgence of interest in purchasing the asset. Interestingly, the 50-day MA is getting closer to the 200-day MA but has not made a clear cross yet, which gives bulls a last-minute chance to drive the price higher and make the bearish setup invalid. This possible recovery scenario is further supported by the recent volume surge.
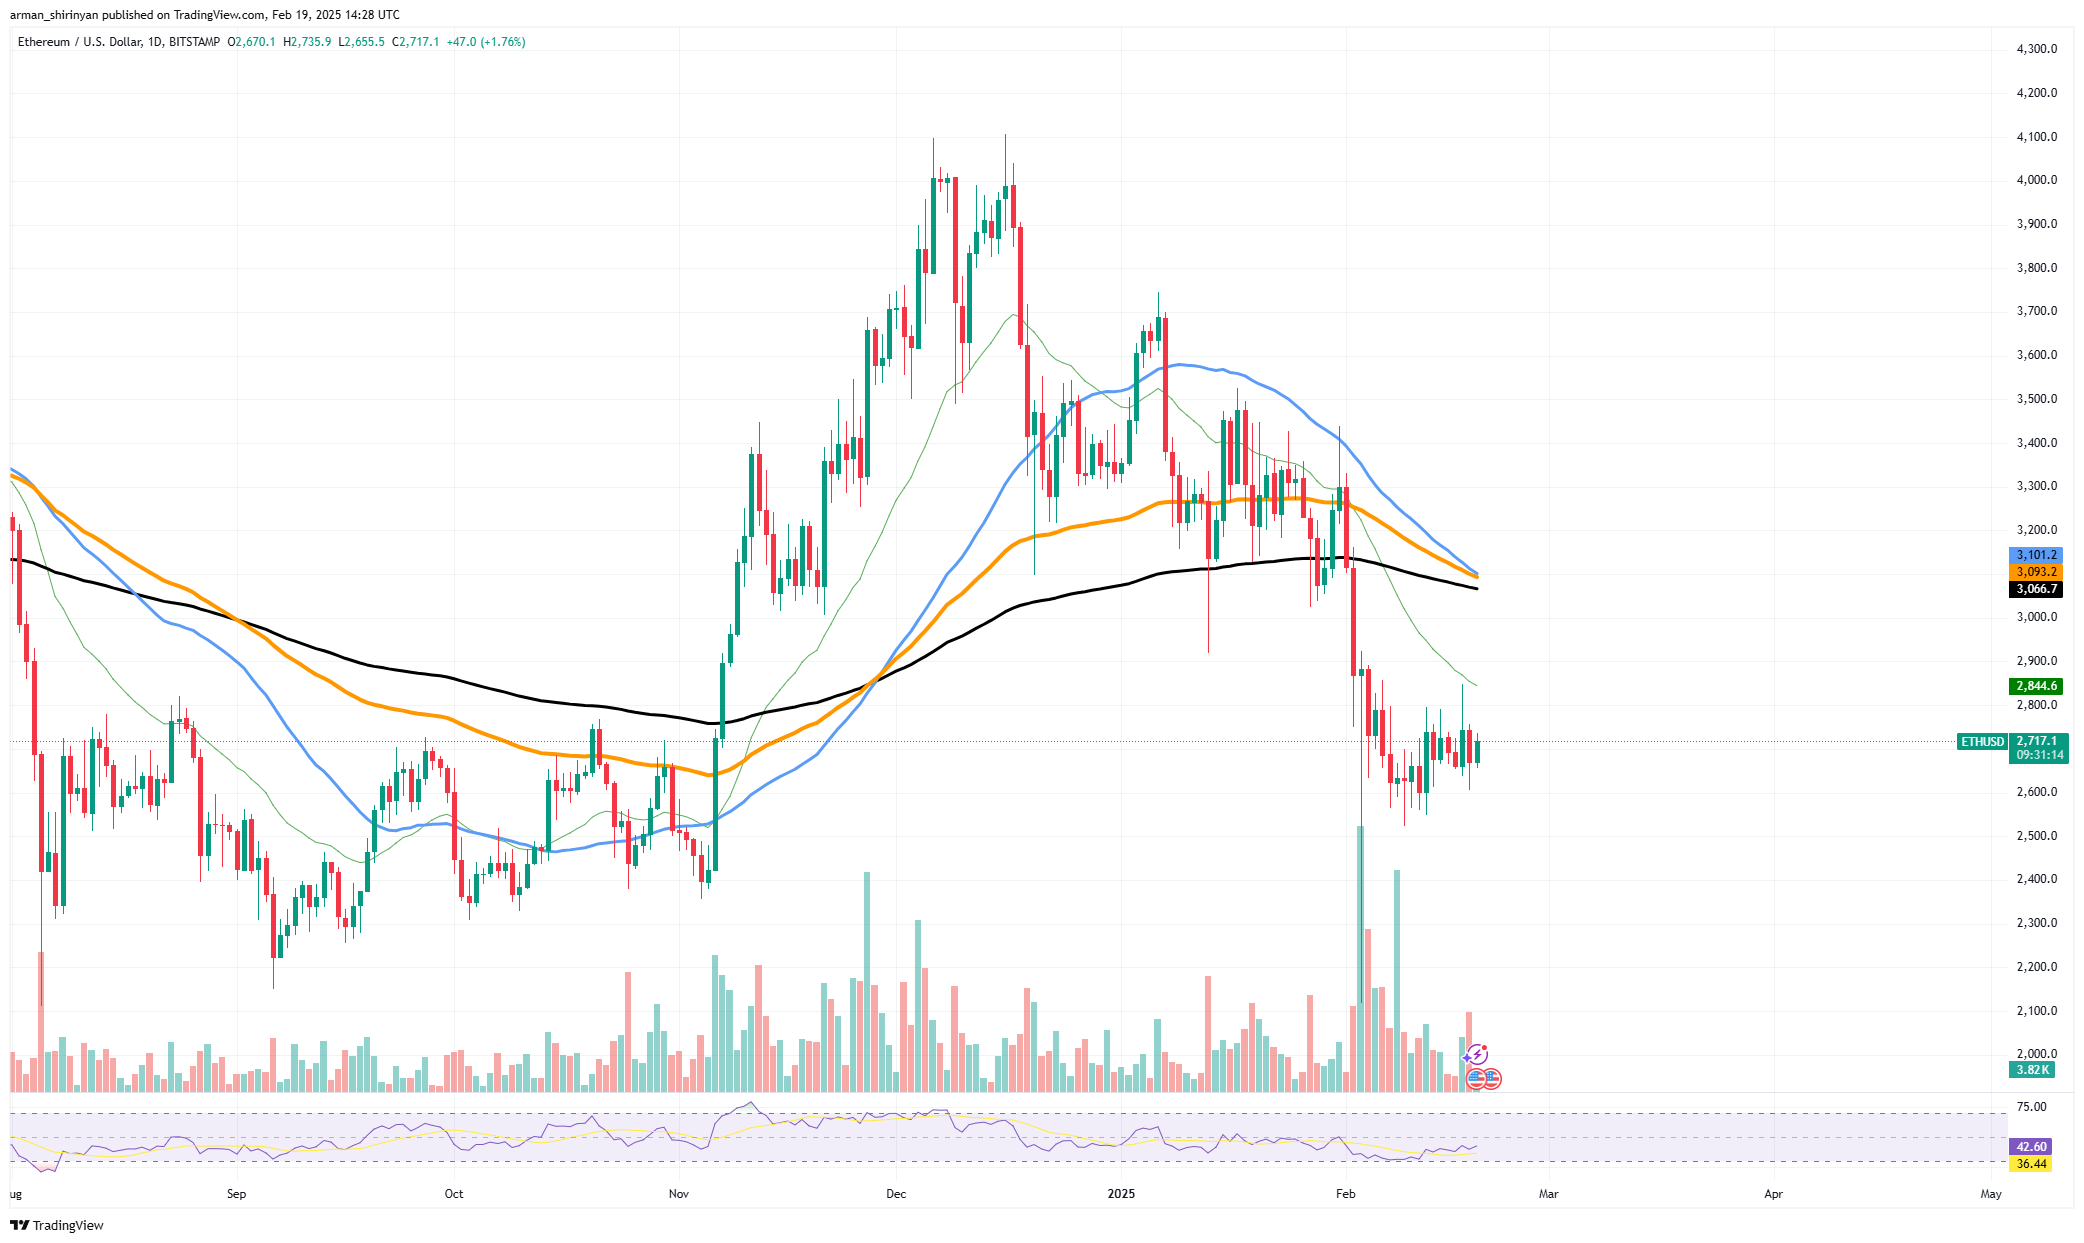
Growing market activity suggests that buyers are intervening and trying to retake control of ETH‘s price movement, particularly on green days. In order to avoid the death cross and create a more optimistic outlook, Ethereum may be able to maintain its current course and break above the $3,000 resistance level. On the down side, additional drops could result from the inability to overcome significant resistance.
A death cross is more likely if ETH falls back below $2,700 and selling pressure increases, which could hasten the decline. Ethereum’s overall success in avoiding the bearish signal will depend on its capacity to sustain its upward momentum over the next few days. Bulls need to hold onto their current positions and move toward the $3,000 mark in order to nullify the death cross and maintain a stronger position on the market.
Advertisement
XRP holders should not miss it
On its price chart, XRP is developing an interesting but frequently disregarded technical pattern that could portend a significant move soon. A tilted head and shoulders formation is suggested by the price structure; if invalidated, this could be the setup for a breakout or a warning of a reversal. Due to its slanted neckline, this pattern is more difficult to spot at first glance than traditional head and shoulders setups.
Since late 2024, XRP’s price has been supported by an upward trendline, which it is currently circling. It is imperative to hold this level because a breakdown might drive the asset closer to the important support level, which is around $2.25. If bulls are unable to sustain their momentum, a move below this level could validate the head and shoulders pattern’s bearish implications, opening the door for additional declines toward $1.74.
Nevertheless, XRP still has an opportunity to overcome resistance and disprove the bearish trend. It has a better chance of rising toward $3.00 if it can recover $2.71 and maintain buying volume. The market would become bullish once more if there were a confirmed breakout above this resistance, thereby negating the head and shoulders formation. Volume is a crucial determinant of XRP’s next course of action.
Mixed trading activity has accompanied recent price action, suggesting that traders are unsure of what to do. A significant volume spike of XRP that keeps it within the rising trendline may give rise to bullish momentum. However, the hidden bearish structure would be confirmed by a low-volume breakdown.
Dogecoin struggles
With the meme coin presently trading below the pivotal 200-day Exponential Moving Average (EMA), Dogecoin has been finding it difficult to regain any bullish momentum. This technical position suggests a lower position relative to other market assets, which may portend more declines or a chance for a recovery.
Recent price activity for DOGE indicates that selling pressure is still present and that the asset is unable to break through resistance levels with conviction. Any attempt to move higher may encounter resistance due to the 200 EMA’s strong barrier. A lack of significant buying interest at the moment is also indicated by the trading volume, which is still quite low.
Despite this, Dogecoin has a history of sudden spikes, frequently brought on by market movements, celebrity endorsements or social media hype. In the event that a catalyst appears, DOGE may recover quickly and test resistance at $0.30, which is in line with its prior rejection point. DOGE needs to move above $0.28 and then reclaim the 200 EMA as support in order to set up a bullish trajectory.
Search
RECENT PRESS RELEASES
Related Post


