GM Powers All U.S. Facilities with 100% Renewable Energy
May 14, 2026
May 15, 2026
General Motors has announced that it now powers all of its United States facilities entirely with renewable energy, a milestone the company says it achieved last year. The automaker claims it is the first in the U.S. automotive industry to reach this goal, according to a release issued on April 21 ahead of Earth Day.
The company reports that its investments in domestic renewable energy have contributed approximately $1.9 billion to gross domestic product since 2015. Projects contracted through 2026 are expected to generate an additional $333 million. In 2025, GM matched 70% of its global electricity consumption with renewable energy, nearly double the amount sourced in 2023. The automaker aims to fully power its global facilities with renewable energy by 2035.
GM has set several additional sustainability targets, including achieving carbon neutrality across its global products and operations by 2040. The company also plans to reduce scope 1 and 2 emissions by 72% by 2035 relative to a 2018 baseline, cut scope 3 emissions from the use of sold products by 51% per vehicle kilometer by 2035 compared to 2018 levels, and decrease water intensity by 35% by 2035 against a 2010 baseline. Since 2018, GM says it has reduced its operational emissions by 52%.
The company’s sustainability chief, Cassandra Garber, noted in a LinkedIn post that GM has more than halved its operational emissions while growing revenue by 26% since 2018. Garber, who was appointed to her role last year, previously served as chief sustainability officer for Dell Technologies. She said her position allows her to help accelerate GM’s decarbonization and net-zero goals, adding that the automaker is already advancing the transition to electric vehicles and encouraging renewable energy adoption.
GM contracts enough clean energy to match every kilowatt-hour it draws from the grid for U.S. operations, including power purchase agreements with Hilltopper Wind Farm and NorthStar Clean Energy. A 2024 agreement with NorthStar supports operations at three U.S. assembly plants by sourcing renewable electricity from NorthStar’s 180-megawatt solar project in Newport, Arkansas. In 2025, GM’s renewable energy mix consisted largely of clean-energy utility programs (40%), followed by virtual power purchase agreements (37%), unbundled renewable energy credits (14%), default delivered renewable energy (8%), and on-site generation and landfill gas (1%). The company expects its reliance on renewable energy credits to decline as more long-term clean energy projects come online.
-
1. INTRODUCTION
Making Data-Driven Decisions to Grow Your Business
- REPORT DESCRIPTION
- RESEARCH METHODOLOGY AND THE AI PLATFORM
- DATA-DRIVEN DECISIONS FOR YOUR BUSINESS
- GLOSSARY AND SPECIFIC TERMS
-
2. EXECUTIVE SUMMARY
A Quick Overview of Market Performance
- KEY FINDINGS
- MARKET TRENDS This Chapter is Available Only for the Professional EditionPRO
-
3. MARKET OVERVIEW
Understanding the Current State of The Market and its Prospects
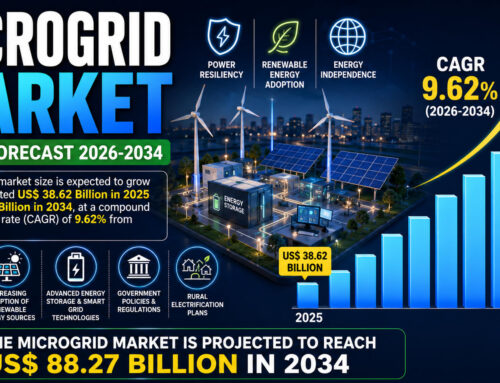
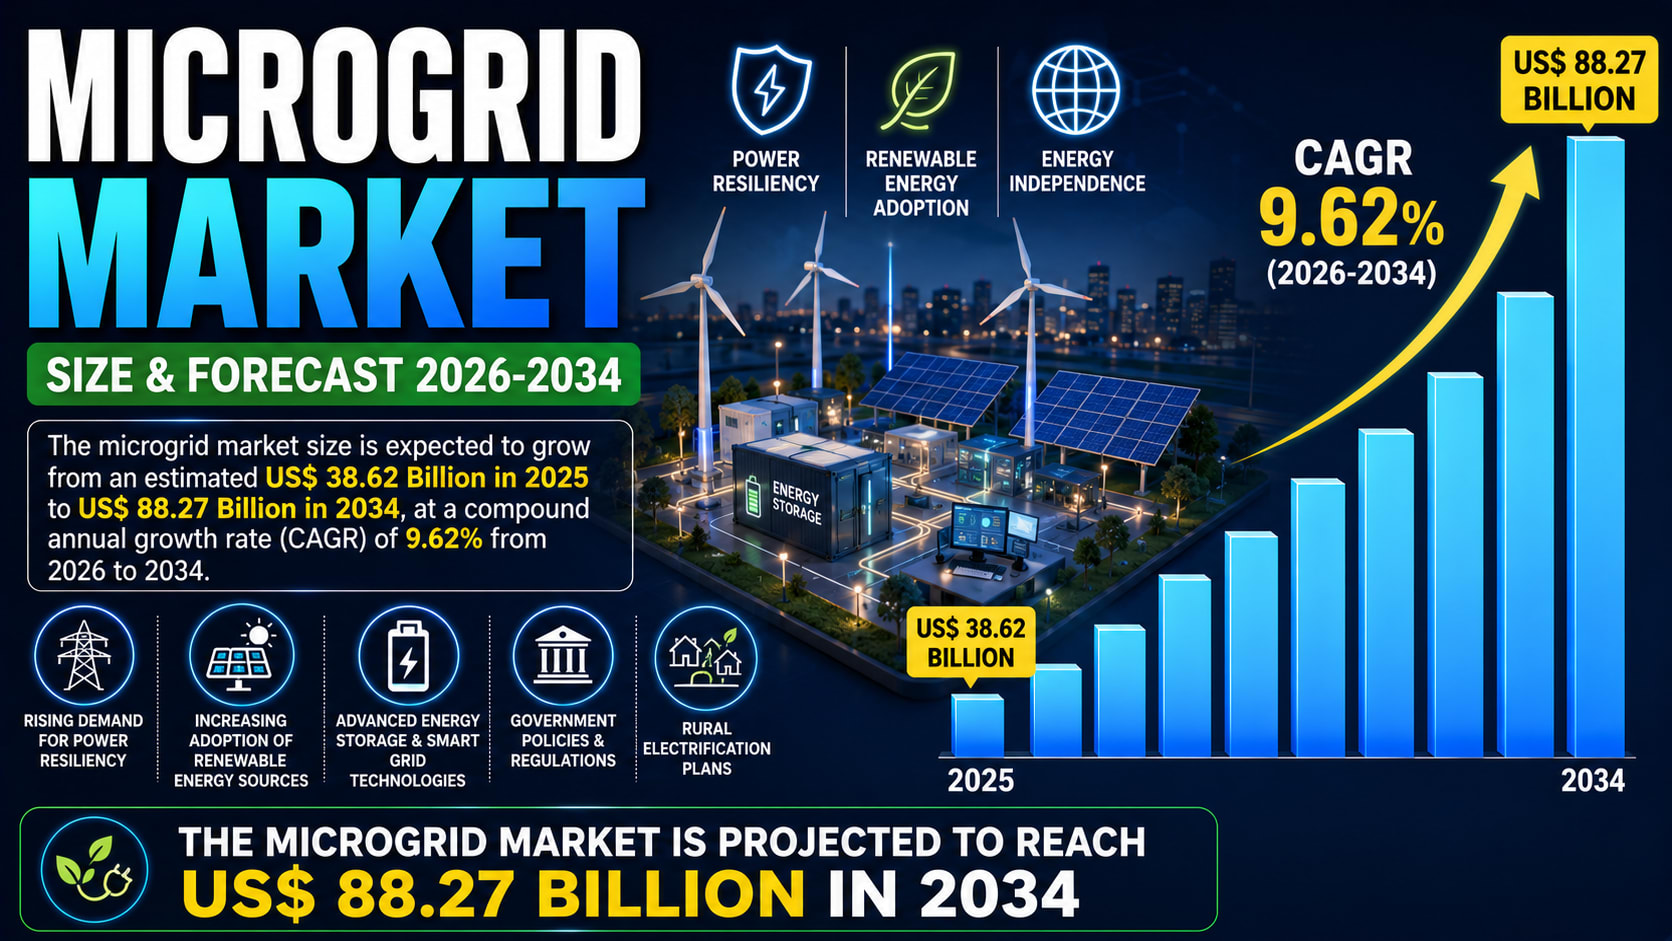
- MARKET SIZE: HISTORICAL DATA (2012–2025) AND FORECAST (2026–2035)
- CONSUMPTION BY COUNTRY: HISTORICAL DATA (2012–2025) AND FORECAST (2026–2035)
- MARKET FORECAST TO 2035
-
4. MOST PROMISING PRODUCTS FOR DIVERSIFICATION
Finding New Products to Diversify Your Business
- TOP PRODUCTS TO DIVERSIFY YOUR BUSINESS
- BEST-SELLING PRODUCTS
- MOST CONSUMED PRODUCTS
- MOST TRADED PRODUCTS
- MOST PROFITABLE PRODUCTS FOR EXPORT
-
5. MOST PROMISING SUPPLYING COUNTRIES
Choosing the Best Countries to Establish Your Sustainable Supply Chain
- TOP COUNTRIES TO SOURCE YOUR PRODUCT
- TOP PRODUCING COUNTRIES
- TOP EXPORTING COUNTRIES
- LOW-COST EXPORTING COUNTRIES
-
6. MOST PROMISING OVERSEAS MARKETS
Choosing the Best Countries to Boost Your Export
- TOP OVERSEAS MARKETS FOR EXPORTING YOUR PRODUCT
- TOP CONSUMING MARKETS
- UNSATURATED MARKETS
- TOP IMPORTING MARKETS
- MOST PROFITABLE MARKETS
-
7. PRODUCTION
The Latest Trends and Insights into The Industry
- PRODUCTION VOLUME AND VALUE: HISTORICAL DATA (2012–2025) AND FORECAST (2026–2035)
- PRODUCTION BY COUNTRY: HISTORICAL DATA (2012–2025) AND FORECAST (2026–2035)
-
8. IMPORTS
The Largest Import Supplying Countries
- IMPORTS: HISTORICAL DATA (2012–2025) AND FORECAST (2026–2035)
- IMPORTS BY COUNTRY: HISTORICAL DATA (2012–2025) AND FORECAST (2026–2035)
- IMPORT PRICES BY COUNTRY: HISTORICAL DATA (2012–2025) AND FORECAST (2026–2035)
-
9. EXPORTS
The Largest Destinations for Exports
- EXPORTS: HISTORICAL DATA (2012–2025) AND FORECAST (2026–2035)
- EXPORTS BY COUNTRY: HISTORICAL DATA (2012–2025) AND FORECAST (2026–2035)
- EXPORT PRICES BY COUNTRY: HISTORICAL DATA (2012–2025) AND FORECAST (2026–2035)
-
10. PROFILES OF MAJOR PRODUCERS
The Largest Producers on The Market and Their Profiles
-
11. COUNTRY PROFILES
The Largest Markets And Their Profiles
This Chapter is Available Only for the Professional Edition
PRO-
11.1
United States
- Market Size
- Production
- Imports
- Exports
-
11.2
China
- Market Size
- Production
- Imports
- Exports
-
11.3
Japan
- Market Size
- Production
- Imports
- Exports
-
11.4
Germany
- Market Size
- Production
- Imports
- Exports
-
11.5
United Kingdom
- Market Size
- Production
- Imports
- Exports
-
11.6
France
- Market Size
- Production
- Imports
- Exports
-
11.7
Brazil
- Market Size
- Production
- Imports
- Exports
-
11.8
Italy
- Market Size
- Production
- Imports
- Exports
-
11.9
Russian Federation
- Market Size
- Production
- Imports
- Exports
-
11.10
India
- Market Size
- Production
- Imports
- Exports
-
11.11
Canada
- Market Size
- Production
- Imports
- Exports
-
11.12
Australia
- Market Size
- Production
- Imports
- Exports
-
11.13
Republic of Korea
- Market Size
- Production
- Imports
- Exports
-
11.14
Spain
- Market Size
- Production
- Imports
- Exports
-
11.15
Mexico
- Market Size
- Production
- Imports
- Exports
-
11.16
Indonesia
- Market Size
- Production
- Imports
- Exports
-
11.17
Netherlands
- Market Size
- Production
- Imports
- Exports
-
11.18
Turkey
- Market Size
- Production
- Imports
- Exports
-
11.19
Saudi Arabia
- Market Size
- Production
- Imports
- Exports
-
11.20
Switzerland
- Market Size
- Production
- Imports
- Exports
-
11.21
Sweden
- Market Size
- Production
- Imports
- Exports
-
11.22
Nigeria
- Market Size
- Production
- Imports
- Exports
-
11.23
Poland
- Market Size
- Production
- Imports
- Exports
-
11.24
Belgium
- Market Size
- Production
- Imports
- Exports
-
11.25
Argentina
- Market Size
- Production
- Imports
- Exports
-
11.26
Norway
- Market Size
- Production
- Imports
- Exports
-
11.27
Austria
- Market Size
- Production
- Imports
- Exports
-
11.28
Thailand
- Market Size
- Production
- Imports
- Exports
-
11.29
United Arab Emirates
- Market Size
- Production
- Imports
- Exports
-
11.30
Colombia
- Market Size
- Production
- Imports
- Exports
-
11.31
Denmark
- Market Size
- Production
- Imports
- Exports
-
11.32
South Africa
- Market Size
- Production
- Imports
- Exports
-
11.33
Malaysia
- Market Size
- Production
- Imports
- Exports
-
11.34
Israel
- Market Size
- Production
- Imports
- Exports
-
11.35
Singapore
- Market Size
- Production
- Imports
- Exports
-
11.36
Egypt
- Market Size
- Production
- Imports
- Exports
-
11.37
Philippines
- Market Size
- Production
- Imports
- Exports
-
11.38
Finland
- Market Size
- Production
- Imports
- Exports
-
11.39
Chile
- Market Size
- Production
- Imports
- Exports
-
11.40
Ireland
- Market Size
- Production
- Imports
- Exports
-
11.41
Pakistan
- Market Size
- Production
- Imports
- Exports
-
11.42
Greece
- Market Size
- Production
- Imports
- Exports
-
11.43
Portugal
- Market Size
- Production
- Imports
- Exports
-
11.44
Kazakhstan
- Market Size
- Production
- Imports
- Exports
-
11.45
Algeria
- Market Size
- Production
- Imports
- Exports
-
11.46
Czech Republic
- Market Size
- Production
- Imports
- Exports
-
11.47
Qatar
- Market Size
- Production
- Imports
- Exports
-
11.48
Peru
- Market Size
- Production
- Imports
- Exports
-
11.49
Romania
- Market Size
- Production
- Imports
- Exports
-
11.50
Vietnam
- Market Size
- Production
- Imports
- Exports
-
-
LIST OF TABLES
- Key Findings In 2025
- Market Volume, In Physical Terms: Historical Data (2012–2025) and Forecast (2026–2035)
- Market Value: Historical Data (2012–2025) and Forecast (2026–2035)
- Per Capita Consumption, by Country, 2022–2025
- Production, In Physical Terms, By Country: Historical Data (2012–2025) and Forecast (2026–2035)
- Imports, In Physical Terms, By Country: Historical Data (2012–2025) and Forecast (2026–2035)
- Imports, In Value Terms, By Country: Historical Data (2012–2025) and Forecast (2026–2035)
- Import Prices, By Country: Historical Data (2012–2025) and Forecast (2026–2035)
- Exports, In Physical Terms, By Country: Historical Data (2012–2025) and Forecast (2026–2035)
- Exports, In Value Terms, By Country: Historical Data (2012–2025) and Forecast (2026–2035)
- Export Prices, By Country: Historical Data (2012–2025) and Forecast (2026–2035)
-
LIST OF FIGURES
- Market Volume, In Physical Terms: Historical Data (2012–2025) and Forecast (2026–2035)
- Market Value: Historical Data (2012–2025) and Forecast (2026–2035)
- Consumption, by Country, 2025
- Market Volume Forecast to 2035
- Market Value Forecast to 2035
- Market Size and Growth, By Product
- Average Per Capita Consumption, By Product
- Exports and Growth, By Product
- Export Prices and Growth, By Product
- Production Volume and Growth
- Exports and Growth
- Export Prices and Growth
- Market Size and Growth
- Per Capita Consumption
- Imports and Growth
- Import Prices
- Production, In Physical Terms: Historical Data (2012–2025) and Forecast (2026–2035)
- Production, In Value Terms: Historical Data (2012–2025) and Forecast (2026–2035)
- Production, by Country, 2025
- Production, In Physical Terms, by Country: Historical Data (2012–2025) and Forecast (2026–2035)
- Imports, In Physical Terms: Historical Data (2012–2025) and Forecast (2026–2035)
- Imports, In Value Terms: Historical Data (2012–2025) and Forecast (2026–2035)
- Imports, In Physical Terms, By Country, 2025
- Imports, In Physical Terms, By Country: Historical Data (2012–2025) and Forecast (2026–2035)
- Imports, In Value Terms, By Country: Historical Data (2012–2025) and Forecast (2026–2035)
- Import Prices, By Country: Historical Data (2012–2025) and Forecast (2026–2035)
- Exports, In Physical Terms: Historical Data (2012–2025) and Forecast (2026–2035)
- Exports, In Value Terms: Historical Data (2012–2025) and Forecast (2026–2035)
- Exports, In Physical Terms, By Country, 2025
- Exports, In Physical Terms, By Country: Historical Data (2012–2025) and Forecast (2026–2035)
- Exports, In Value Terms, By Country: Historical Data (2012–2025) and Forecast (2026–2035)
- Export Prices, By Country: Historical Data (2012–2025) and Forecast (2026–2035)
Search
RECENT PRESS RELEASES
Related Post


